Applications
arXiv:stat.AP
Biology, environmental sciences, social sciences, medical sciences, engineering applications of statistics.
Looking for a broader view? This category is part of:
Biology, environmental sciences, social sciences, medical sciences, engineering applications of statistics.
Looking for a broader view? This category is part of:
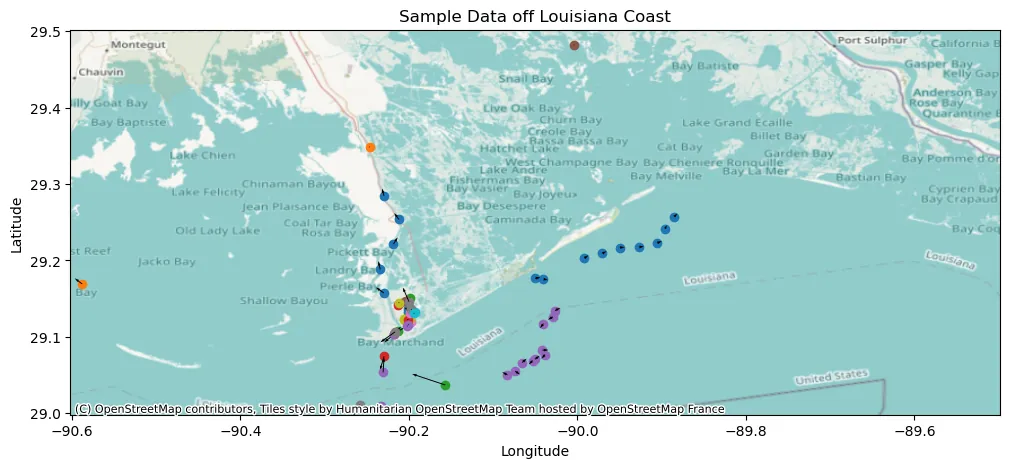
The Automatic Identification System (AIS) provides time stamped vessel positions and kinematic reports that enable maritime authorities to monitor traffic. We consider the problem of relabeling AIS trajectories when vessel identifiers are missing, focusing on a challenging nationwide setting in which tracks are heavily downsampled and span diverse operating environments across continental U.S. waters. We propose a hybrid pipeline that first applies a physics-based screening step to project active track endpoints forward in time and select a small set of plausible ancestors for each new observation. A supervised neural classifier then chooses among these candidates, or initiates a new track, using engineered space time and kinematic consistency features. On held out data, this approach improves posit accuracy relative to unsupervised baselines, demonstrating that combining simple motion models with learned disambiguation can scale vessel relabeling to heterogeneous, high volume AIS streams.
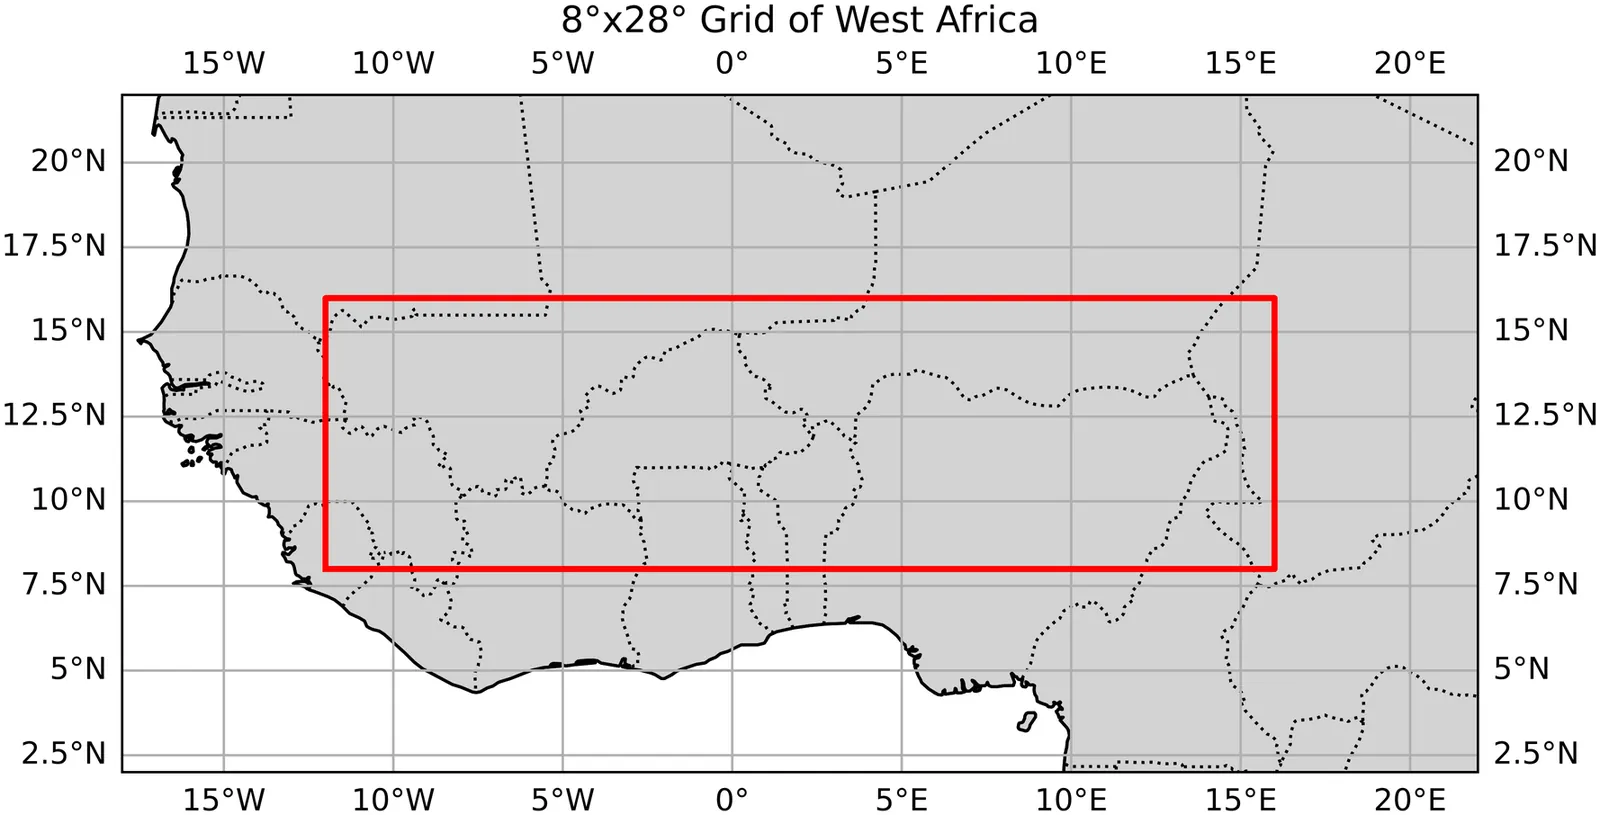
The beginning of the rainy season and the occurrence of dry spells in West Africa is notoriously difficult to predict, however these are the key indicators farmers use to decide when to plant crops, having a major influence on their overall yield. While many studies have shown correlations between global sea surface temperatures and characteristics of the West African monsoon season, there are few that effectively implementing this information into machine learning (ML) prediction models. In this study we investigated the best ways to define our target variables, onset and dry spell, and produced methods to predict them for upcoming seasons using sea surface temperature teleconnections. Defining our target variables required the use of a combination of two well known definitions of onset. We then applied custom statistical techniques -- like total variation regularization and predictor selection -- to the two models we constructed, the first being a linear model and the other an adaptive-threshold logistic regression model. We found mixed results for onset prediction, with spatial verification showing signs of significant skill, while temporal verification showed little to none. For dry spell though, we found significant accuracy through the analysis of multiple binary classification metrics. These models overcome some limitations that current approaches have, such as being computationally intensive and needing bias correction. We also introduce this study as a framework to use ML methods for targeted prediction of certain weather phenomenon using climatologically relevant variables. As we apply ML techniques to more problems, we see clear benefits for fields like meteorology and lay out a few new directions for further research.
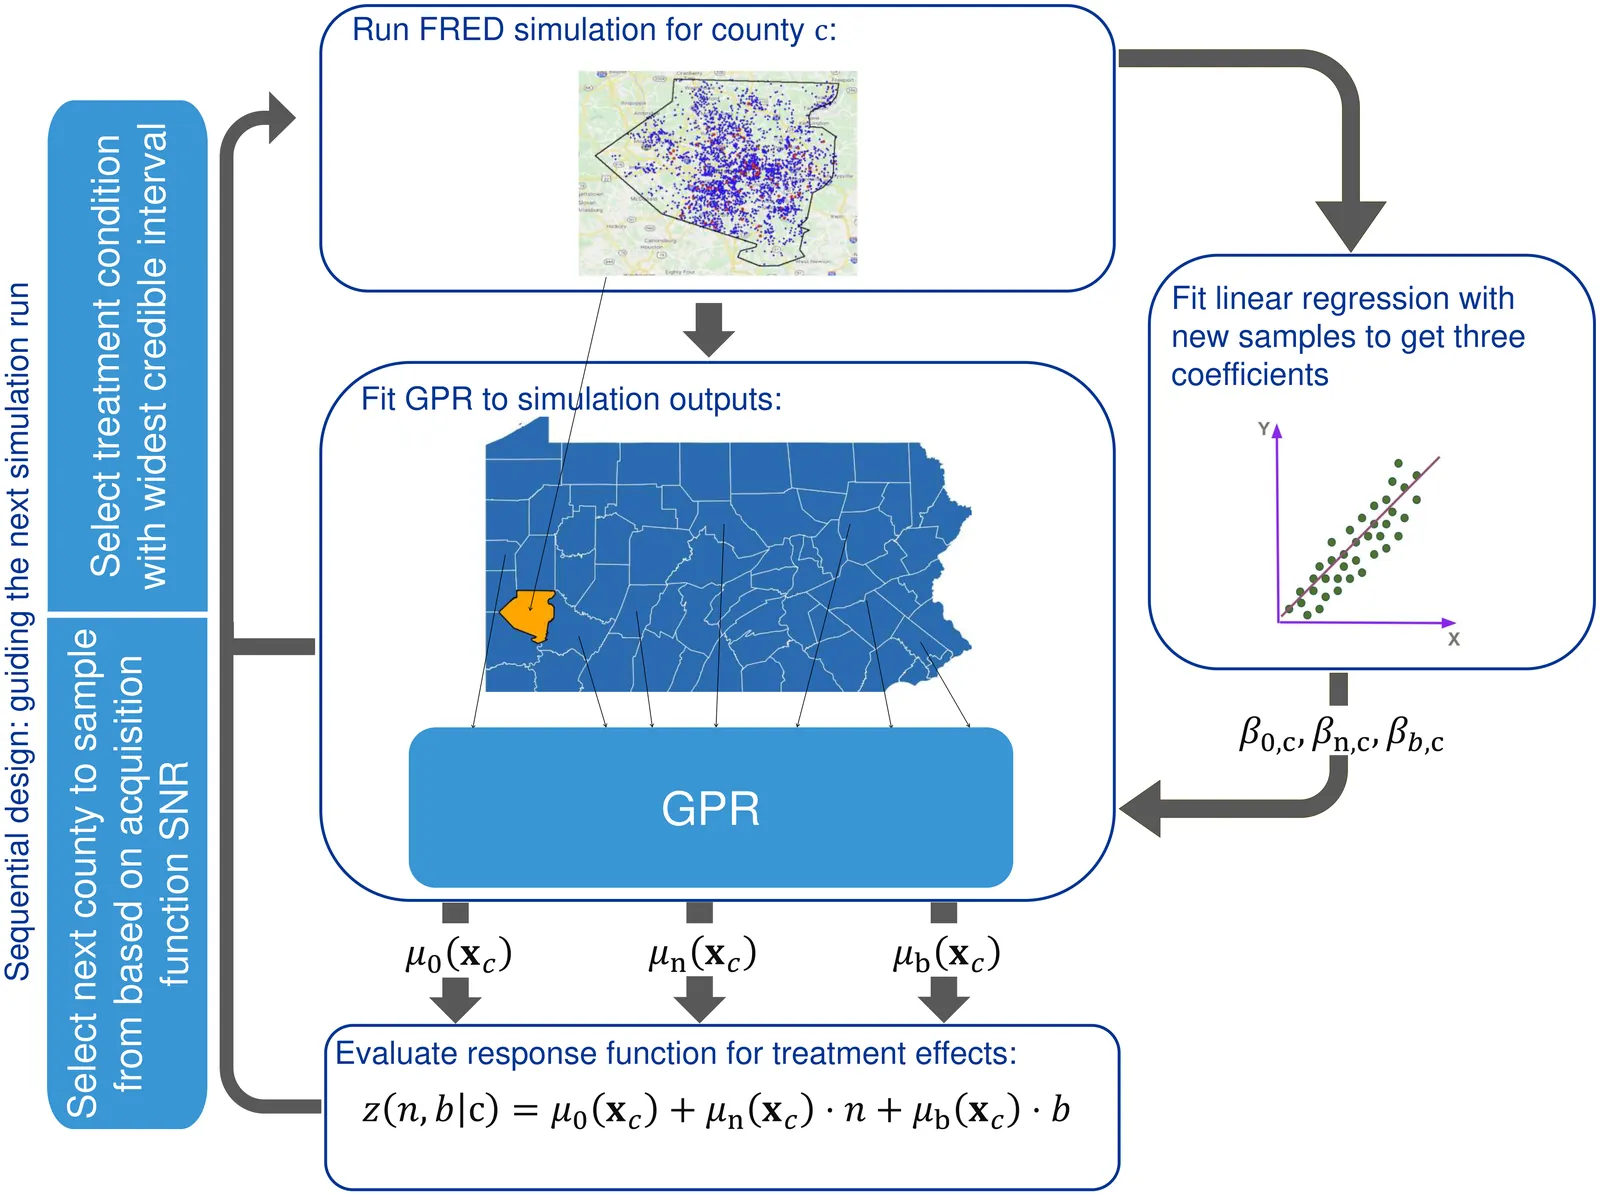
Population-scale agent-based simulations of the opioid epidemic help evaluate intervention strategies and overdose outcomes in heterogeneous communities and provide estimates of localized treatment effects, which support the design of locally-tailored policies for precision public health. However, it is prohibitively costly to run simulations of all treatment conditions in all communities because the number of possible treatments grows exponentially with the number of interventions and levels at which they are applied. To address this need efficiently, we develop a metamodel framework, whereby treatment outcomes are modeled using a response function whose coefficients are learned through Gaussian process regression (GPR) on locally-contextualized covariates. We apply this framework to efficiently estimate treatment effects on overdose deaths in Pennsylvania counties. In contrast to classical designs such as fractional factorial design or Latin hypercube sampling, our approach leverages spatial correlations and posterior uncertainty to sequentially sample the most informative counties and treatment conditions. Using a calibrated agent-based opioid epidemic model, informed by county-level overdose mortality and baseline dispensing rate data for different treatments, we obtained county-level estimates of treatment effects on overdose deaths per 100,000 population for all treatment conditions in Pennsylvania, achieving approximately 5% average relative error using one-tenth the number of simulation runs required for exhaustive evaluation. Our bi-level framework provides a computationally efficient approach to decision support for policy makers, enabling rapid evaluation of alternative resource-allocation strategies to mitigate the opioid epidemic in local communities. The same analytical framework can be applied to guide precision public health interventions in other epidemic settings.
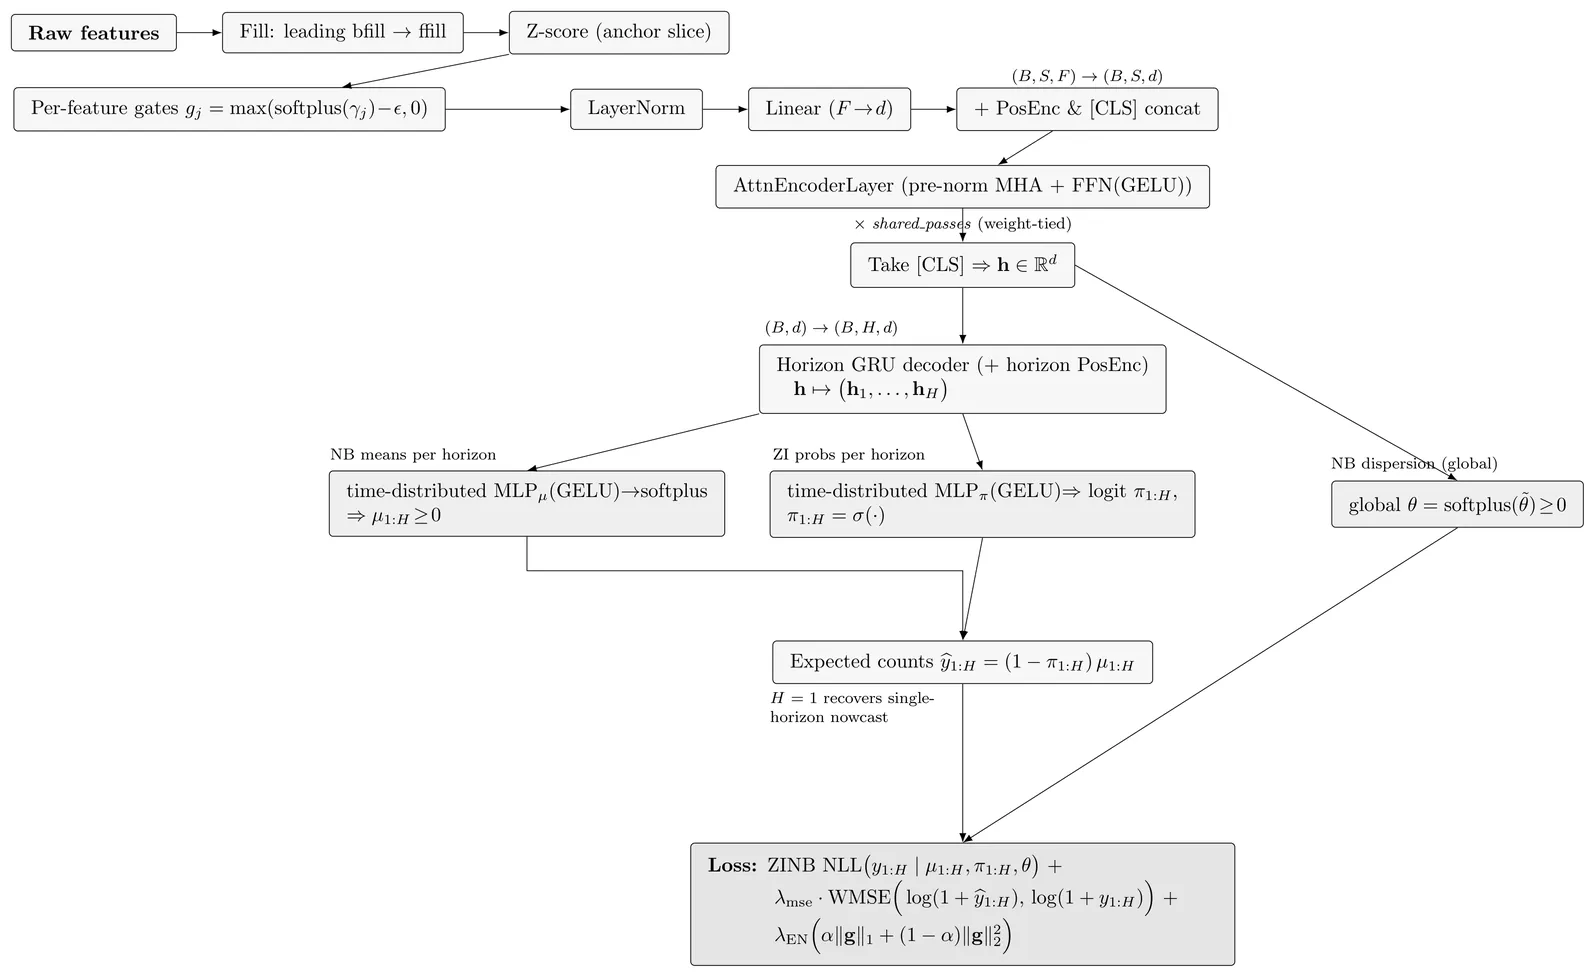
Forecasting conflict-related fatalities remains a central challenge in political science and policy analysis due to the sparse, bursty, and highly non-stationary nature of violence data. We introduce DynAttn, an interpretable dynamic-attention forecasting framework for high-dimensional spatio-temporal count processes. DynAttn combines rolling-window estimation, shared elastic-net feature gating, a compact weight-tied self-attention encoder, and a zero-inflated negative binomial (ZINB) likelihood. This architecture produces calibrated multi-horizon forecasts of expected casualties and exceedance probabilities, while retaining transparent diagnostics through feature gates, ablation analysis, and elasticity measures. We evaluate DynAttn using global country-level and high-resolution PRIO-grid-level conflict data from the VIEWS forecasting system, benchmarking it against established statistical and machine-learning approaches, including DynENet, LSTM, Prophet, PatchTST, and the official VIEWS baseline. Across forecast horizons from one to twelve months, DynAttn consistently achieves substantially higher predictive accuracy, with particularly large gains in sparse grid-level settings where competing models often become unstable or degrade sharply. Beyond predictive performance, DynAttn enables structured interpretation of regional conflict dynamics. In our application, cross-regional analyses show that short-run conflict persistence and spatial diffusion form the core predictive backbone, while climate stress acts either as a conditional amplifier or a primary driver depending on the conflict theater.
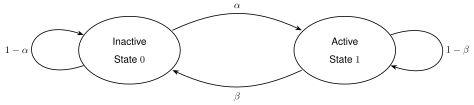
High-content screening microscopy generates large amounts of live-cell imaging data, yet its potential remains constrained by the inability to determine when and where to image most effectively. Optimally balancing acquisition time, computational capacity, and photobleaching budgets across thousands of dynamically evolving regions of interest remains an open challenge, further complicated by limited field-of-view adjustments and sensor sensitivity. Existing approaches either rely on static sampling or heuristics that neglect the dynamic evolution of biological processes, leading to inefficiencies and missed events. Here, we introduce the restless multi-process multi-armed bandit (RMPMAB), a new decision-theoretic framework in which each experimental region is modeled not as a single process but as an ensemble of Markov chains, thereby capturing the inherent heterogeneity of biological systems such as asynchronous cell cycles and heterogeneous drug responses. Building upon this foundation, we derive closed-form expressions for transient and asymptotic behaviors of aggregated processes, and design scalable Whittle index policies with sub-linear complexity in the number of imaging regions. Through both simulations and a real biological live-cell imaging dataset, we show that our approach achieves substantial improvements in throughput under resource constraints. Notably, our algorithm outperforms Thomson Sampling, Bayesian UCB, epsilon-Greedy, and Round Robin by reducing cumulative regret by more than 37% in simulations and capturing 93% more biologically relevant events in live imaging experiments, underscoring its potential for transformative smart microscopy. Beyond improving experimental efficiency, the RMPMAB framework unifies stochastic decision theory with optimal autonomous microscopy control, offering a principled approach to accelerate discovery across multidisciplinary sciences.
The Automatic Identification System (AIS) provides time stamped vessel positions and kinematic reports that enable maritime authorities to monitor traffic. We consider the problem of relabeling AIS trajectories when vessel identifiers are missing, focusing on a challenging nationwide setting in which tracks are heavily downsampled and span diverse operating environments across continental U.S. waters. We propose a hybrid pipeline that first applies a physics-based screening step to project active track endpoints forward in time and select a small set of plausible ancestors for each new observation. A supervised neural classifier then chooses among these candidates, or initiates a new track, using engineered space time and kinematic consistency features. On held out data, this approach improves posit accuracy relative to unsupervised baselines, demonstrating that combining simple motion models with learned disambiguation can scale vessel relabeling to heterogeneous, high volume AIS streams.
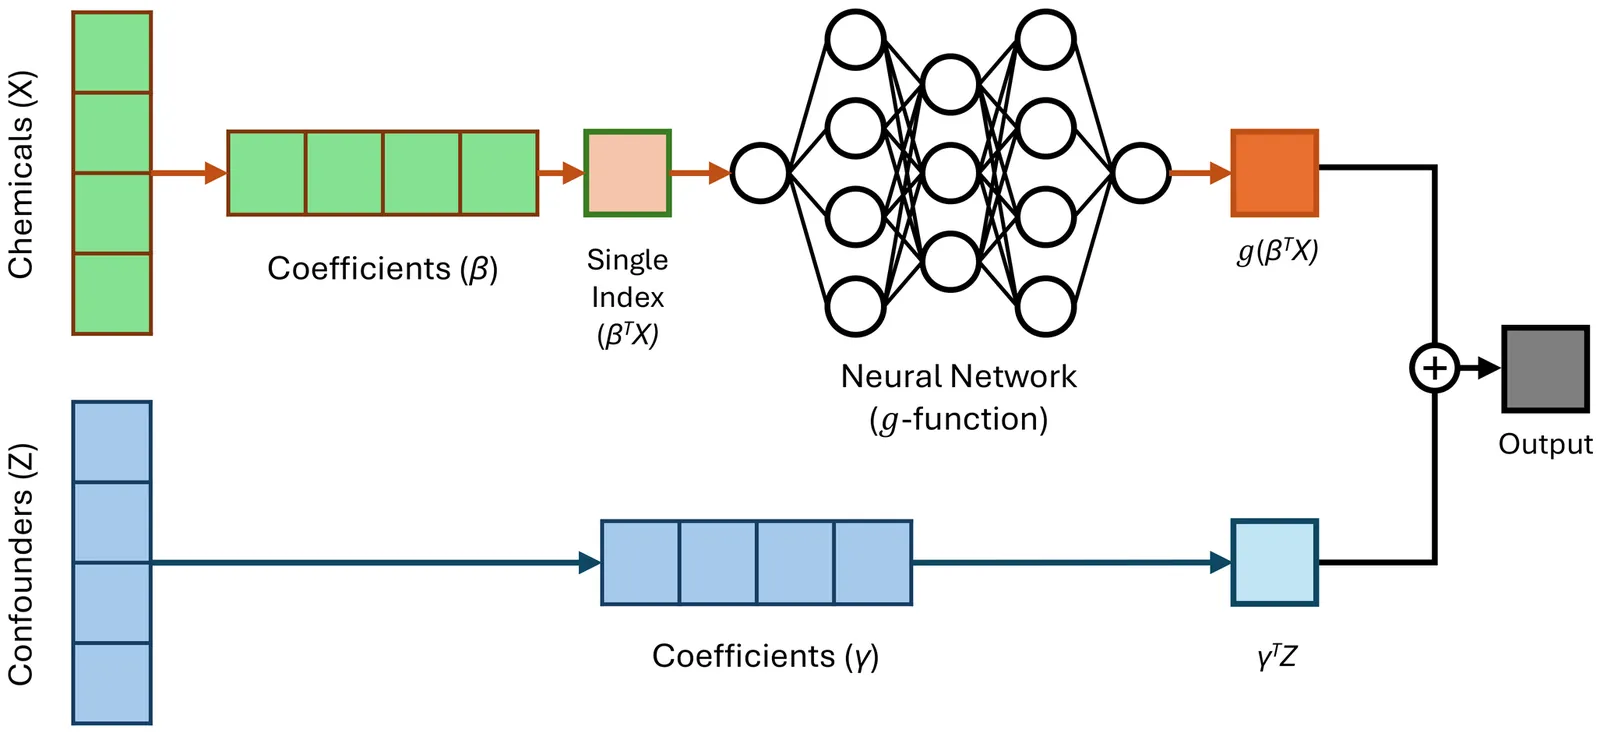
Evaluating the health effects of complex environmental mixtures remains a central challenge in environmental health research. Existing approaches vary in their flexibility, interpretability, scalability, and support for diverse outcome types, often limiting their utility in real-world applications. To address these limitations, we propose a neural network-based partial-linear single-index (NeuralPLSI) modeling framework that bridges semiparametric regression modeling interpretability with the expressive power of deep learning. The NeuralPLSI model constructs an interpretable exposure index via a learnable projection and models its relationship with the outcome through a flexible neural network. The framework accommodates continuous, binary, and time-to-event outcomes, and supports inference through a bootstrap-based procedure that yields confidence intervals for key model parameters. We evaluated NeuralPLSI through simulation studies under a range of scenarios and applied it to data from the National Health and Nutrition Examination Survey (NHANES) to demonstrate its practical utility. Together, our contributions establish NeuralPLSI as a scalable, interpretable, and versatile modeling tool for mixture analysis. To promote adoption and reproducibility, we release a user-friendly open-source software package that implements the proposed methodology and supports downstream visualization and inference (\texttt{https://github.com/hyungrok-do/NeuralPLSI}).
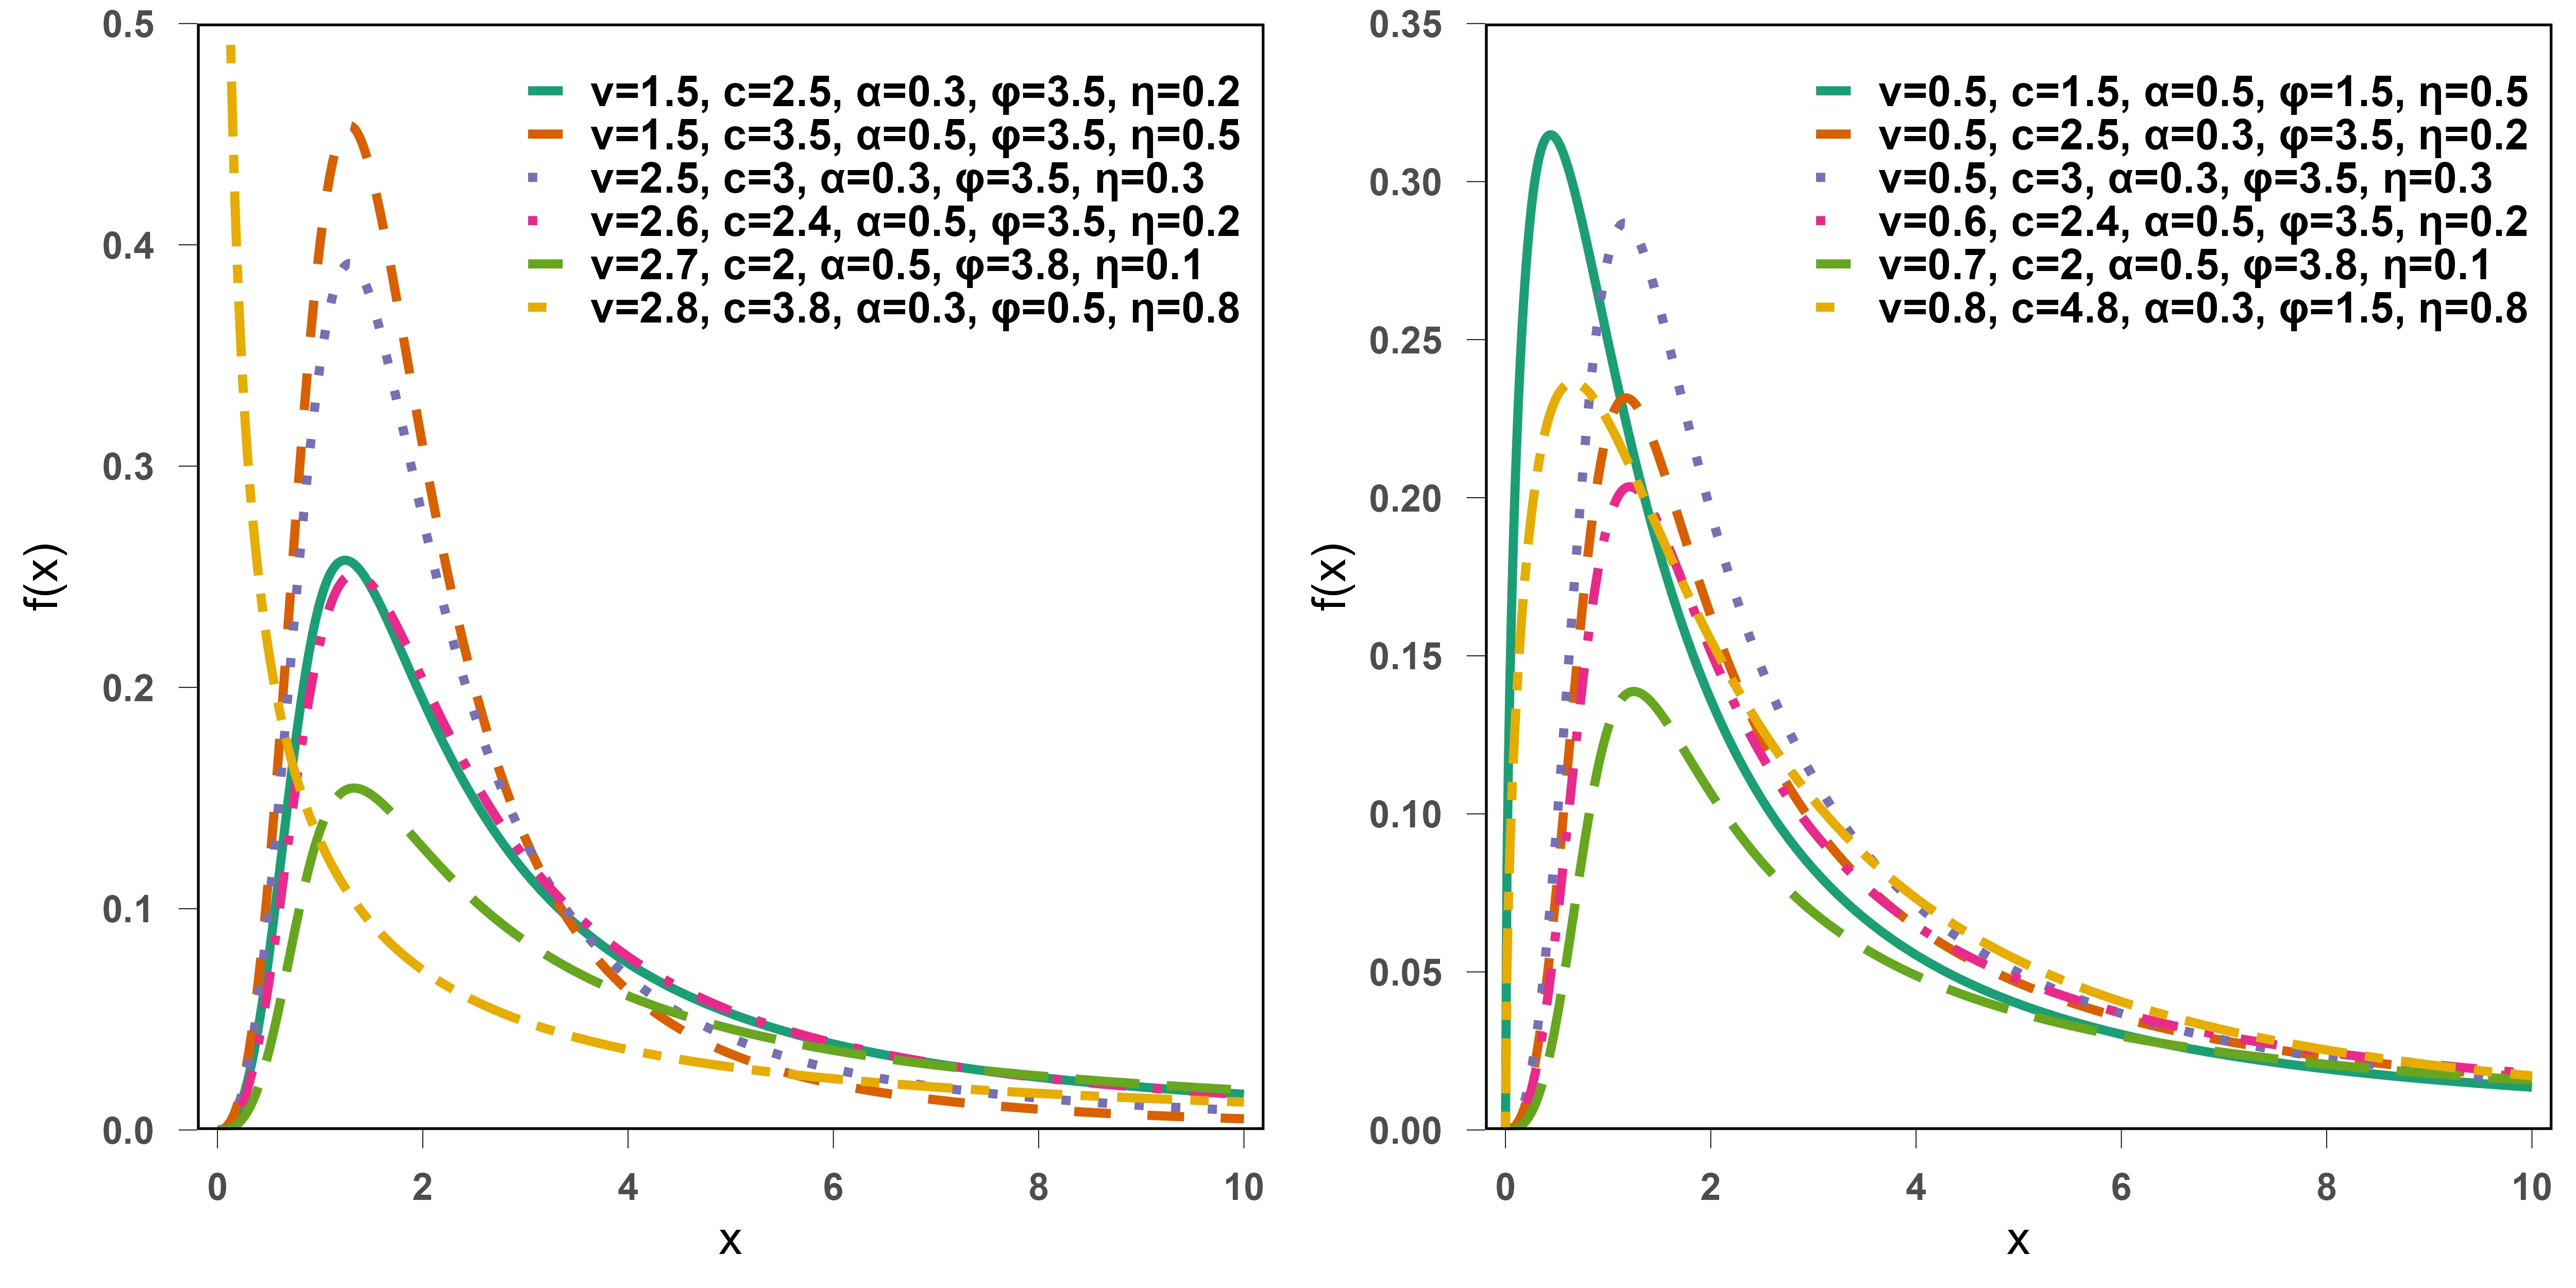
This study introduces a new family of probability distributions, termed the alpha power Harris-generalized (APHG) family. The generator arises by incorporating two shape parameters from the Harris-G framework into the alpha power transformation, resulting in a more flexible class for modelling survival and reliability data. A special member of this family, obtained using the two-parameter Burr XII distribution as the baseline, is developed and examined in detail. Several analytical properties of the proposed alpha power Harris Burr XII (APHBXII) model are derived, which include closed-form expressions for its moments, mean and median deviations, Bonferroni and Lorenz curves, order statistics, and Renyi and Tsallis entropies. Parameter estimation is performed via maximum likelihood, and a Monte Carlo simulation study is carried out to assess the finite-sample performance of the estimators. In addition, three real lifetime datasets are analyzed to evaluate the empirical performance of the APHBXII distribution relative to four competing models. The results show that the five-parameter APHBXII model provides superior fit across all datasets, as supported by model-selection criteria and goodness-of-fit statistics.
 2512.10066
The remarkable success of AlphaFold2 in providing accurate atomic-level prediction of protein structures from their amino acid sequence has transformed approaches to the protein folding problem. However, its core paradigm of mapping one sequence to one structure may only be appropriate for single-fold proteins with one stable conformation. Metamorphic proteins, which can adopt multiple distinct conformations, have conformational diversity that cannot be adequately modeled by AlphaFold2. Hence, classifying whether a given protein is metamorphic or single-fold remains a critical challenge for both laboratory experiments and computational methods. To address this challenge, we developed a novel classification framework by re-purposing AlphaFold2 to generate conformational ensembles via a multiple sequence alignment sampling method. From these ensembles, we extract a comprehensive set of features characterizing the conformational ensemble's modality and structural dispersion. A random forest classifier trained on a carefully curated benchmark dataset of known metamorphic and single-fold proteins achieves a mean AUC of 0.869 with cross-validation, demonstrating the effectiveness of our integrated approach. Furthermore, by applying our classifier to 600 randomly sampled proteins from the Protein Data Bank, we identified several potential metamorphic protein candidates -- including the 40S ribosomal protein S30, whose conformational change is crucial for its secondary function in antimicrobial defense. By combining AI-driven protein structure prediction with statistical learning, our work provides a powerful new approach for discovering metamorphic proteins and deepens our understanding of their role in their molecular function.
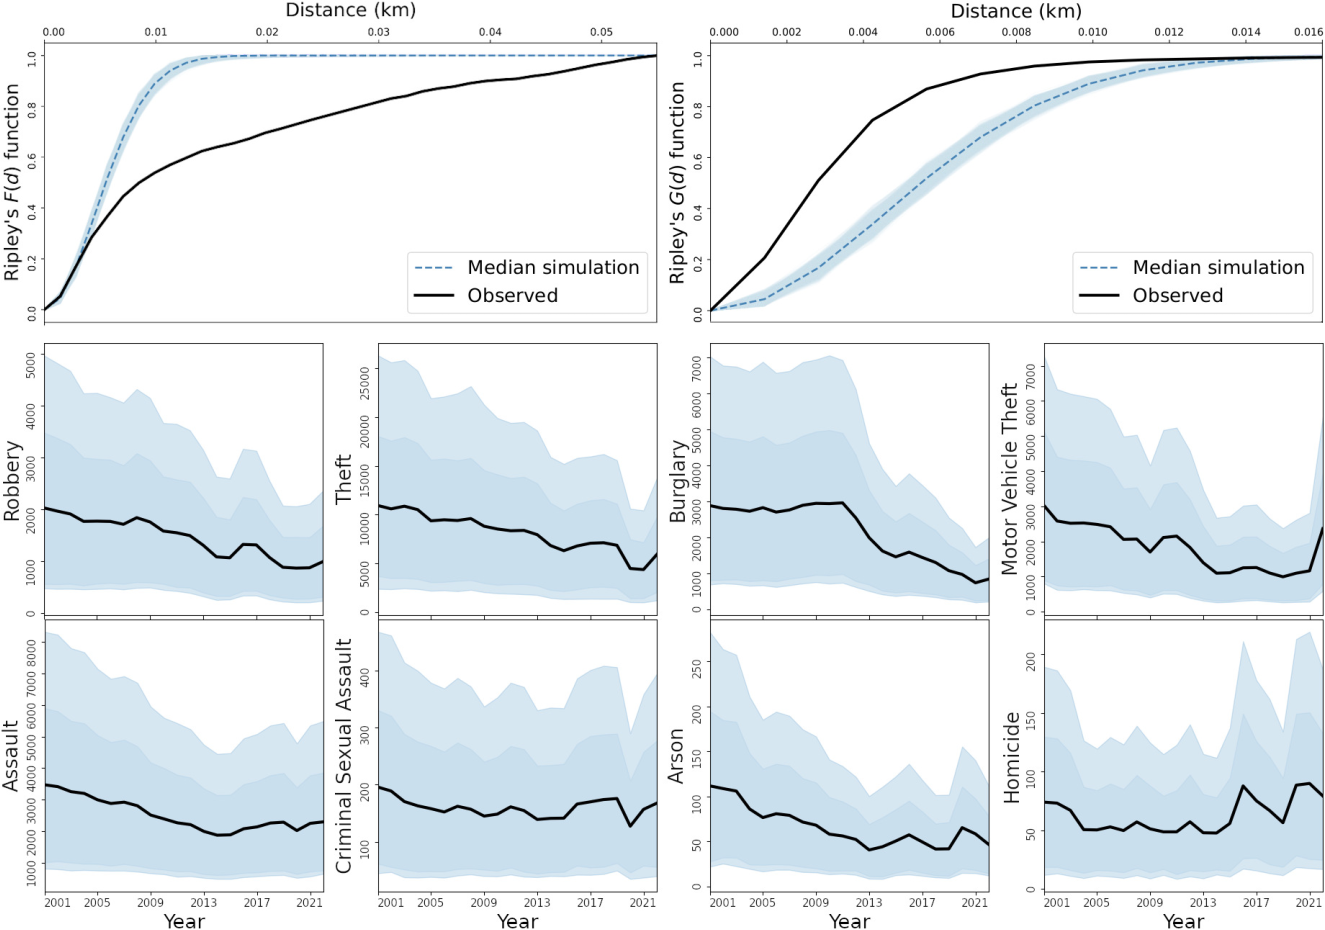
Crime prevention measures, aiming for the effective and efficient spending of public resources, rely on the empirical analysis of spatial and temporal data for public safety outcomes. We perform a variable-density cluster analysis on crime incident reports in the City of Chicago for the years 2001--2022 to investigate changes in crime share composition for hot spots of different densities. Contributing to and going beyond the existing wealth of research on criminological applications in the operational research literature, we study the evolution of crime type shares in clusters over the course of two decades and demonstrate particularly notable impacts of the COVID-19 pandemic and its associated social contact avoidance measures, as well as a dependence of these effects on the primary function of city areas. Our results also indicate differences in the relative difficulty to address specific crime types, and an analysis of spatial autocorrelations further shows variations in incident uniformity between clusters and outlier areas at different distance radii. We discuss our findings in the context of the interplay between operational research and criminal justice, the practice of hot spot policing and public safety optimization, and the factors contributing to, and challenges and risks due to, data biases as an often neglected factor in criminological applications.
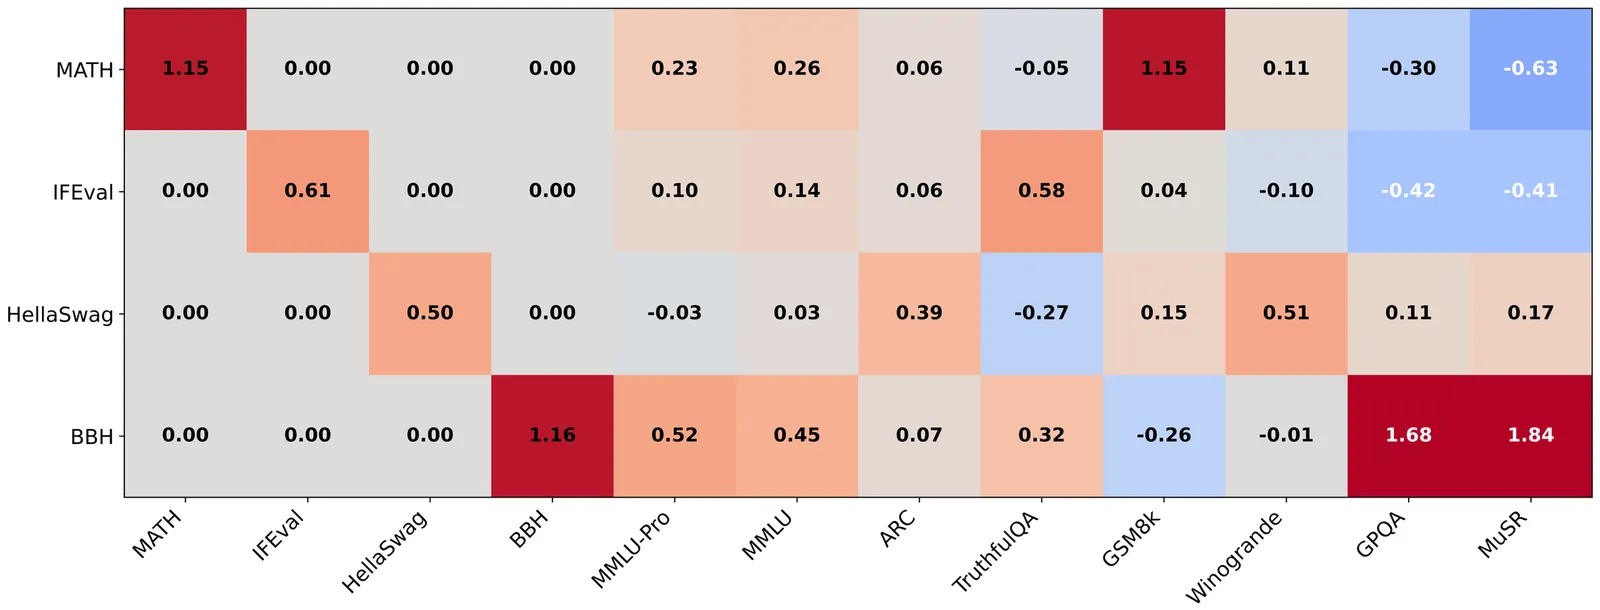
We propose a statistical framework built on latent variable modeling for scaling laws of large language models (LLMs). Our work is motivated by the rapid emergence of numerous new LLM families with distinct architectures and training strategies, evaluated on an increasing number of benchmarks. This heterogeneity makes a single global scaling curve inadequate for capturing how performance varies across families and benchmarks. To address this, we propose a latent variable modeling framework in which each LLM family is associated with a latent variable that captures the common underlying features in that family. An LLM's performance on different benchmarks is then driven by its latent skills, which are jointly determined by the latent variable and the model's own observable features. We develop an estimation procedure for this latent variable model and establish its statistical properties. We also design efficient numerical algorithms that support estimation and various downstream tasks. Empirically, we evaluate the approach on 12 widely used benchmarks from the Open LLM Leaderboard (v1/v2).
Predictions of fatalities from violent conflict on the PRIO-GRID-month (pgm) level are characterized by high levels of uncertainty, limiting their usefulness in practical applications. We discuss the two main sources of uncertainty for this prediction task, the nature of violent conflict and data limitations, embedding this in the wider literature on uncertainty quantification in machine learning. We develop a strategy to quantify uncertainty in conflict forecasting, shifting from traditional point predictions to full predictive distributions. Our approach compares and combines multiple tree-based classifiers and distributional regressors in a custom auto-ML setup, estimating distributions for each pgm individually. We also test the integration of regional models in spatial ensembles as a potential avenue to reduce uncertainty. The models are able to consistently outperform a suite of benchmarks derived from conflict history in predictions up to one year in advance, with performance driven by regions where conflict was observed. With our evaluation, we emphasize the need to understand how a metric behaves for a given prediction problem, in our case characterized by extremely high zero-inflatedness. While not resulting in better predictions, the integration of smaller models does not decrease performance for this prediction task, opening avenues to integrate data sources with less spatial coverage in the future.

We introduce a compact probabilistic model for two-player and two-team (four-player) squash matches, along with a practical skill-comparison rule derived from point-scoring probabilities. Using recorded shot types and court locations, we analyze how shot distributions differ between professional-level and intermediate-level players. Our analysis shows that professional players use a wider variety of shots and favor backcourt play to maintain control, while intermediate players concentrate more on mid-court shots, generate more errors, and exercise less positional control. These results quantify strategic differences in squash, offer a simple method to compare player and team skill, and provide actionable insights for sports analytics and coaching.
The beginning of the rainy season and the occurrence of dry spells in West Africa is notoriously difficult to predict, however these are the key indicators farmers use to decide when to plant crops, having a major influence on their overall yield. While many studies have shown correlations between global sea surface temperatures and characteristics of the West African monsoon season, there are few that effectively implementing this information into machine learning (ML) prediction models. In this study we investigated the best ways to define our target variables, onset and dry spell, and produced methods to predict them for upcoming seasons using sea surface temperature teleconnections. Defining our target variables required the use of a combination of two well known definitions of onset. We then applied custom statistical techniques -- like total variation regularization and predictor selection -- to the two models we constructed, the first being a linear model and the other an adaptive-threshold logistic regression model. We found mixed results for onset prediction, with spatial verification showing signs of significant skill, while temporal verification showed little to none. For dry spell though, we found significant accuracy through the analysis of multiple binary classification metrics. These models overcome some limitations that current approaches have, such as being computationally intensive and needing bias correction. We also introduce this study as a framework to use ML methods for targeted prediction of certain weather phenomenon using climatologically relevant variables. As we apply ML techniques to more problems, we see clear benefits for fields like meteorology and lay out a few new directions for further research.
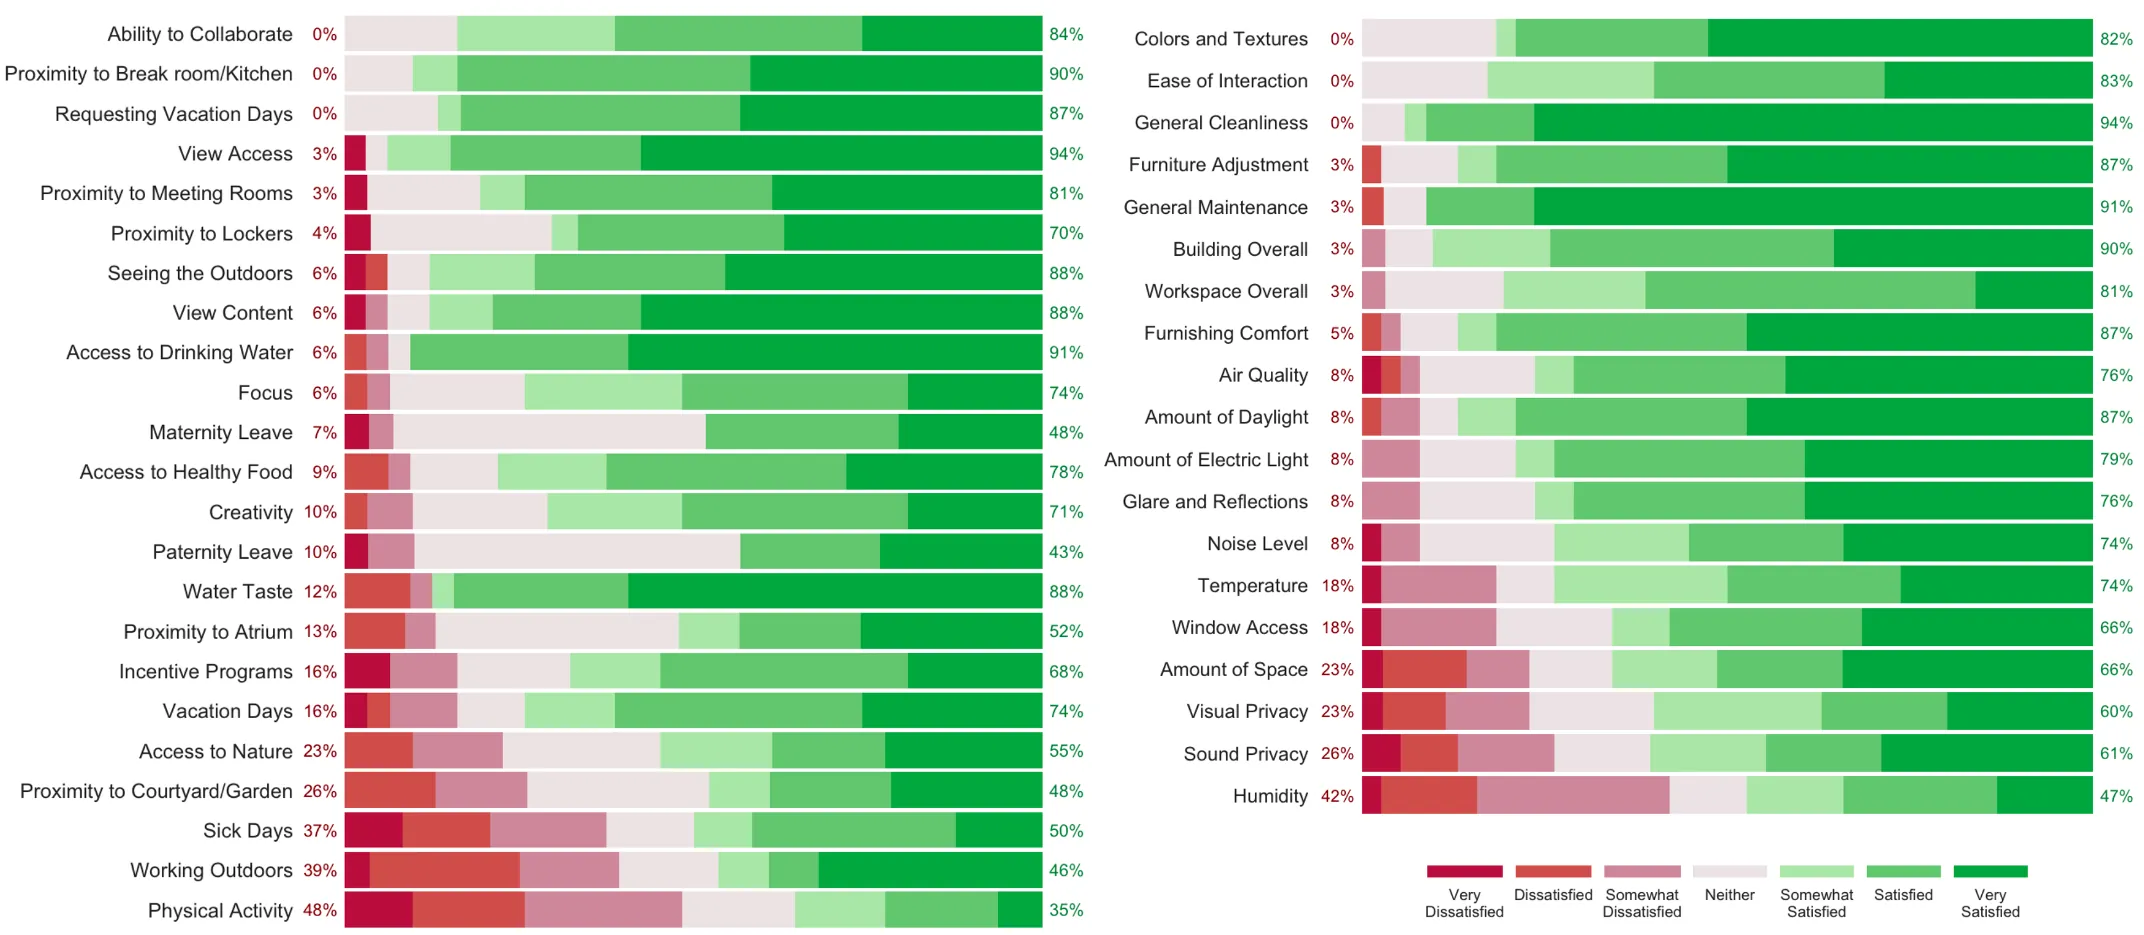
Human-factor analysis typically employs correlation analysis and significance testing to identify relationships between variables. However, these descriptive ('what-is') methods, while effective for identifying associations, are often insufficient for answering causal ('what-if') questions. Their application in such contexts often overlooks confounding and colliding variables, potentially leading to bias and suboptimal or incorrect decisions. We advocate for explicitly distinguishing descriptive from interventional questions in human-factor analysis, and applying causal inference frameworks specifically to these problems to prevent methodological mismatches. This approach disentangles complex variable relationships and enables counterfactual reasoning. Using post-occupancy evaluation (POE) data from the Center for the Built Environment's (CBE) Occupant Survey as a demonstration case, we show how causal discovery reveals intervention hierarchies and directional relationships that traditional associational analysis misses. The systematic distinction between causally associated and independent variables, combined with intervention prioritization capabilities, offers broad applicability to complex human-centric systems, for example, in building science or ergonomics, where understanding intervention effects is critical for optimization and decision-making.

Expected goals (xG) models estimate the probability that a shot results in a goal from its context (e.g., location, pressure), but they operate only on observed shots. We propose xG+, a possession-level framework that first estimates the probability that a shot occurs within the next second and its corresponding xG if it were to occur. We also introduce ways to aggregate this joint probability estimate over the course of a possession. By jointly modeling shot-taking behavior and shot quality, xG+ remedies the conditioning-on-shots limitation of standard xG. We show that this improves predictive accuracy at the team level and produces a more persistent player skill signal than standard xG models.
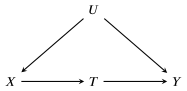
This paper explains why internal and external validity cannot be simultaneously maximised. It introduces "evidential states" to represent the information available for causal inference and shows that routine study operations (restriction, conditioning, and intervention) transform these states in ways that do not commute. Because each operation removes or reorganises information differently, changing their order yields evidential states that support different causal claims. This non-commutativity creates a structural trade-off: the steps that secure precise causal identification also eliminate the heterogeneity required for generalisation. Small model, observational and experimental examples illustrate how familiar failures of transportability arise from this order dependence. The result is a concise structural account of why increasing causal precision necessarily narrows the world to which findings apply.
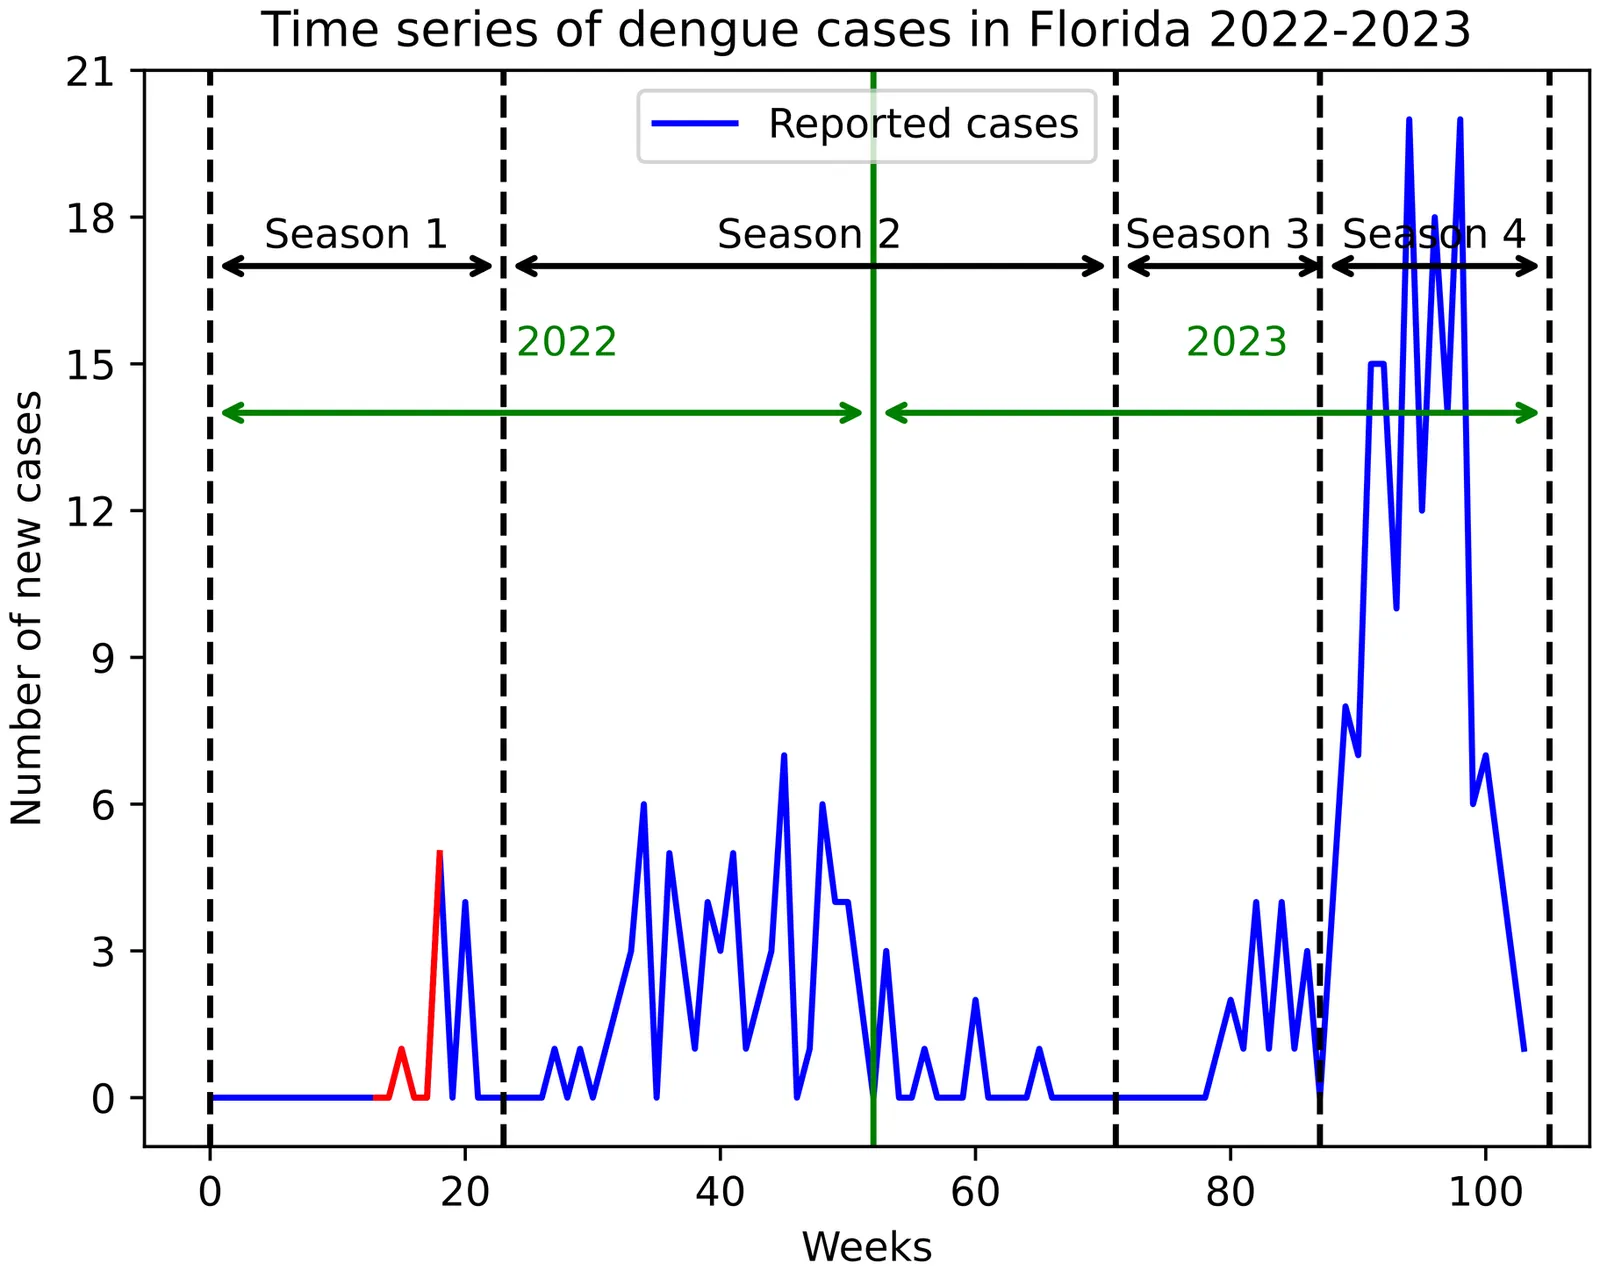
Reliable and timely dengue predictions provide actionable lead time for targeted vector control and clinical preparedness, reducing preventable diseases and health-system costs in at-risk communities. Dengue forecasting often relies on site-specific covariates and entomological data, limiting generalizability in data-sparse settings. We propose a data-parsimonious (DP) framework based on the incidence versus cumulative cases (ICC) curve, extending it from a basic SIR to a two-population SEIR model for dengue. Our DP model uses only the target season's incidence time series and estimates only two parameters, reducing noise and computational burden. A Bayesian extension quantifies the case reporting and fitting uncertainty to produce calibrated predictive intervals. We evaluated the performance of the DP model in the 2022-2023 outbreaks in Florida, where standardized clinical tests and reporting support accurate case determination. The DP framework demonstrates competitive predictive performance at substantially lower computational cost than more elaborate models, making it suitable for dengue early detection where dense surveillance or long historical records are unavailable.
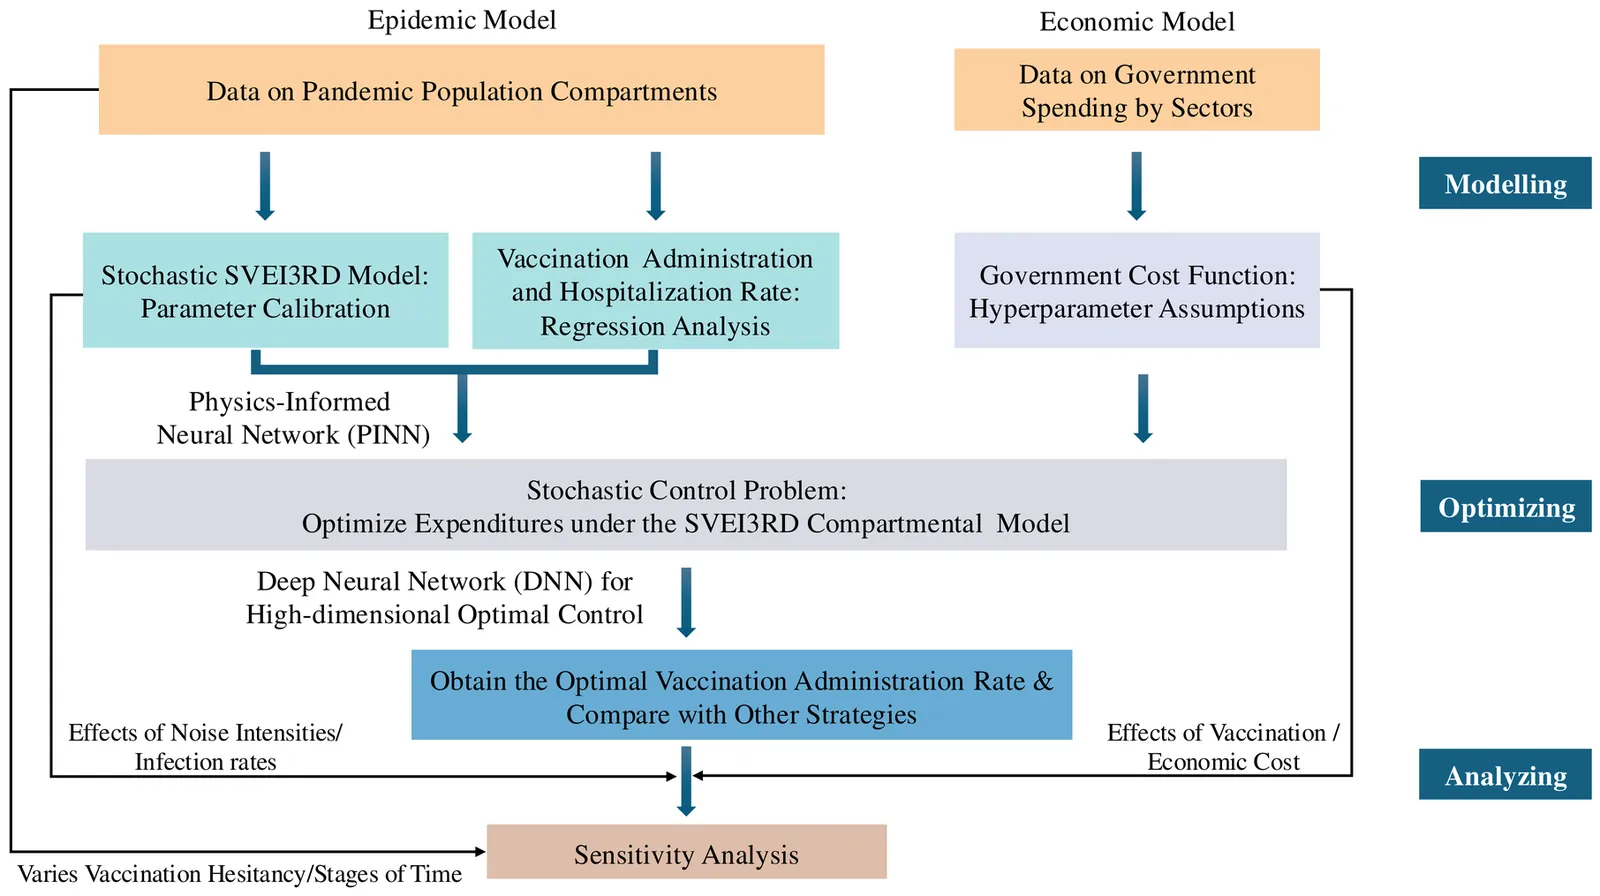
Epidemic risk assessment poses inherent challenges, with traditional approaches often failing to balance health outcomes and economic constraints. This paper presents a data-driven decision support tool that models epidemiological dynamics and optimises vaccination strategies to control disease spread whilst minimising economic losses. The proposed economic-epidemiological framework comprises three phases: modelling, optimising, and analysing. First, a stochastic compartmental model captures epidemic dynamics. Second, an optimal control problem is formulated to derive vaccination strategies that minimise pandemic-related expenditure. Given the analytical intractability of epidemiological models, neural networks are employed to calibrate parameters and solve the high-dimensional control problem. The framework is demonstrated using COVID-19 data from Victoria, Australia, empirically deriving optimal vaccination strategies that simultaneously minimise disease incidence and governmental expenditure. By employing this three-phase framework, policymakers can adjust input values to reflect evolving transmission dynamics and continuously update strategies, thereby minimising aggregate costs, aiding future pandemic preparedness.
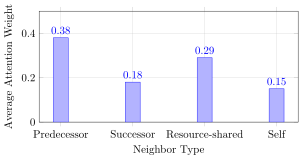
Accurate prediction of project duration and cost remains one of the most challenging aspects of project management, particularly in resource-constrained and interdependent task networks. Traditional analytical techniques such as the Critical Path Method (CPM) and Program Evaluation and Review Technique (PERT) rely on simplified and often static assumptions regarding task interdependencies and resource performance. This study proposes a novel resource-based predictive framework that integrates network representations of project activities with graph neural networks (GNNs) to capture structural and contextual relationships among tasks, resources, and time-cost dynamics. The model represents the project as a heterogeneous activity-resource graph in which nodes denote activities and resources, and edges encode temporal and resource dependencies. We evaluate multiple learning paradigms, including GraphSAGE and Temporal Graph Networks, on both synthetic and benchmark project datasets. Experimental results show that the proposed GNN framework achieves an average 23 to 31 percent reduction in mean absolute error compared to traditional regression and tree-based methods, while improving the coefficient of determination R2 from approximately 0.78 to 0.91 for large and complex project networks. Furthermore, the learned embeddings provide interpretable insights into resource bottlenecks and critical dependencies, enabling more explainable and adaptive scheduling decisions.
2511.14930In this paper, we provide a novel measure for greenwashing -- i.e., climate-related misinformation -- that shows how polluting companies can use social media advertising related to climate change to redirect criticism. To do so, we identify greenwashing content in 11 million social-political ads in Meta's Ad Targeting Datset with a measurement technique that combines large language models, human coders, and advances in Bayesian item response theory. We show that what is called greenwashing has diverse actors and components, but we also identify a very pernicious form, which we call political greenwashing, that appears to be promoted by fossil fuel companies and related interest groups. Based on ad targeting data, we show that much of this advertising happens via organizations with undisclosed links to the fossil fuel industry. Furthermore, we show that greenwashing ad content is being micro-targeted at left-leaning communities with fossil fuel assets, though we also find comparatively little evidence of ad targeting aimed at influencing public opinion at the national level.
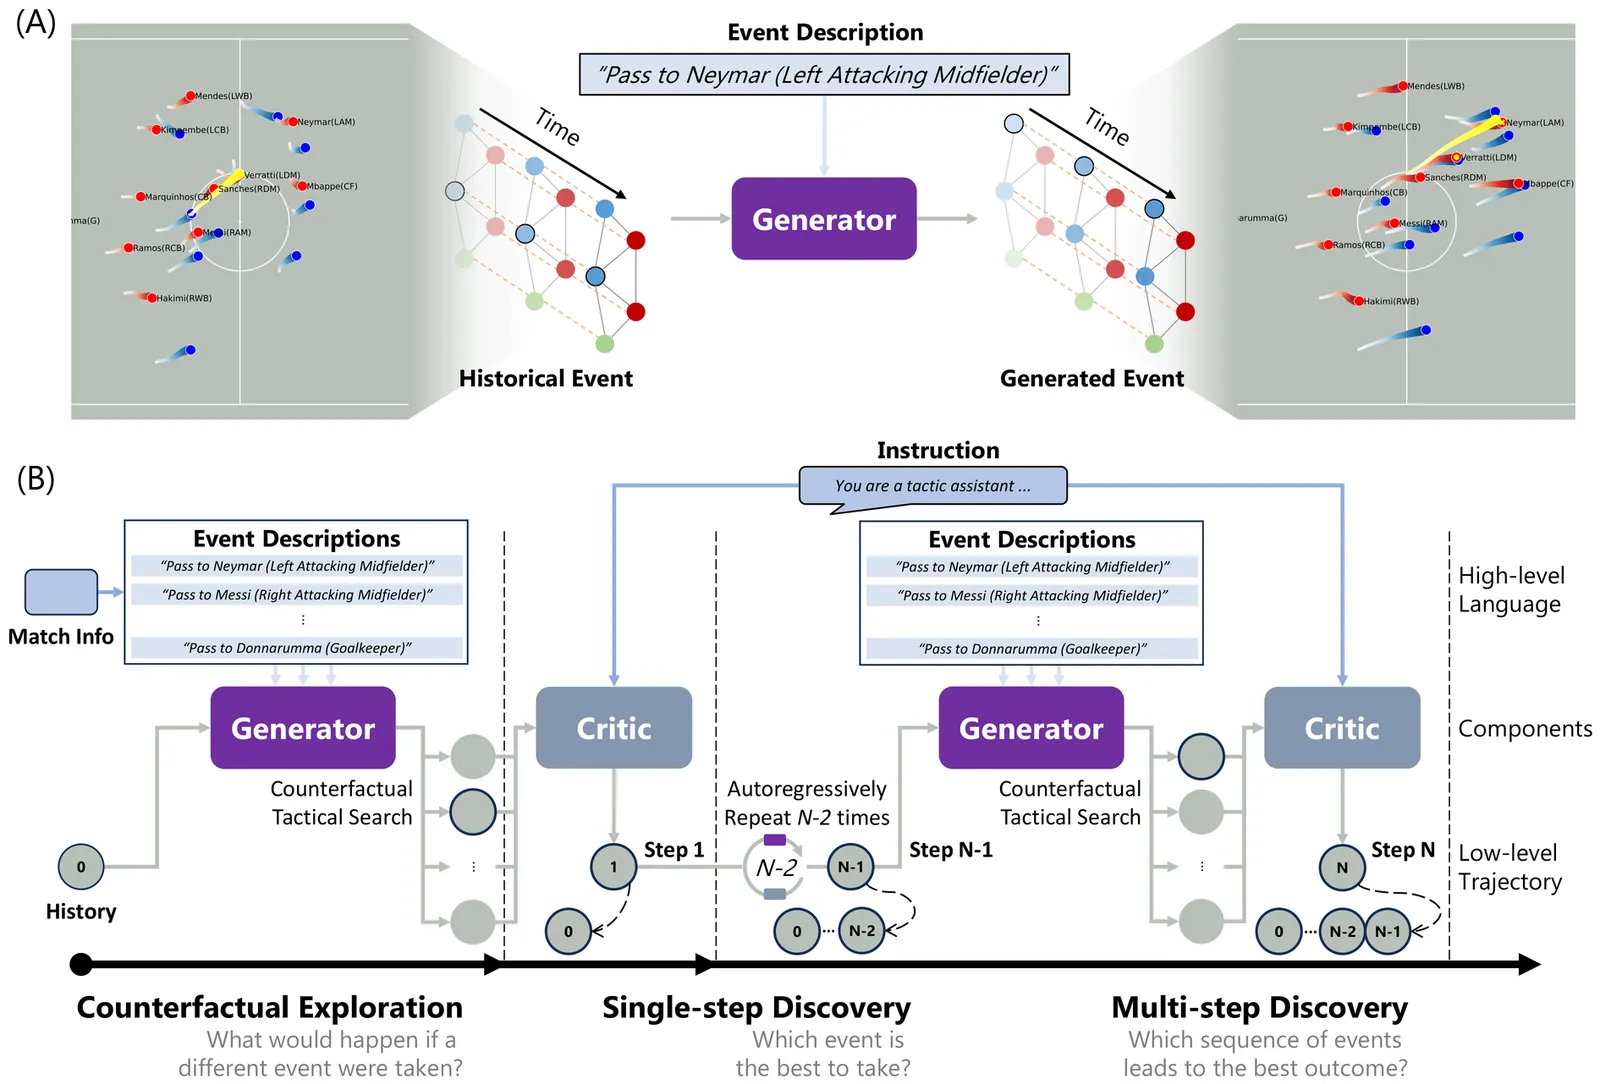
Creating offensive advantages during open play is fundamental to football success. However, due to the highly dynamic and long-sequence nature of open play, the potential tactic space grows exponentially as the sequence progresses, making automated tactic discovery extremely challenging. To address this, we propose TacEleven, a generative framework for football open-play tactic discovery developed in close collaboration with domain experts from AJ Auxerre, designed to assist coaches and analysts in tactical decision-making. TacEleven consists of two core components: a language-controlled tactical generator that produces diverse tactical proposals, and a multimodal large language model-based tactical critic that selects the optimal proposal aligned with a high-level stylistic tactical instruction. The two components enables rapid exploration of tactical proposals and discovery of alternative open-play offensive tactics. We evaluate TacEleven across three tasks with progressive tactical complexity: counterfactual exploration, single-step discovery, and multi-step discovery, through both quantitative metrics and a questionnaire-based qualitative assessment. The results show that the TacEleven-discovered tactics exhibit strong realism and tactical creativity, with 52.50% of the multi-step tactical alternatives rated adoptable in real-world elite football scenarios, highlighting the framework's ability to rapidly generate numerous high-quality tactics for complex long-sequence open-play situations. TacEleven demonstrates the potential of creatively leveraging domain data and generative models to advance tactical analysis in sports.