ScienceStack automatically generates math dependency graphs directly from LaTeX source files.
The process is fully automated — no custom packages required — and works with simple \ref and \label commands.
This was inspired by Terence Tao’s blog post Would it be possible to create a tool to automatically diagram papers?.
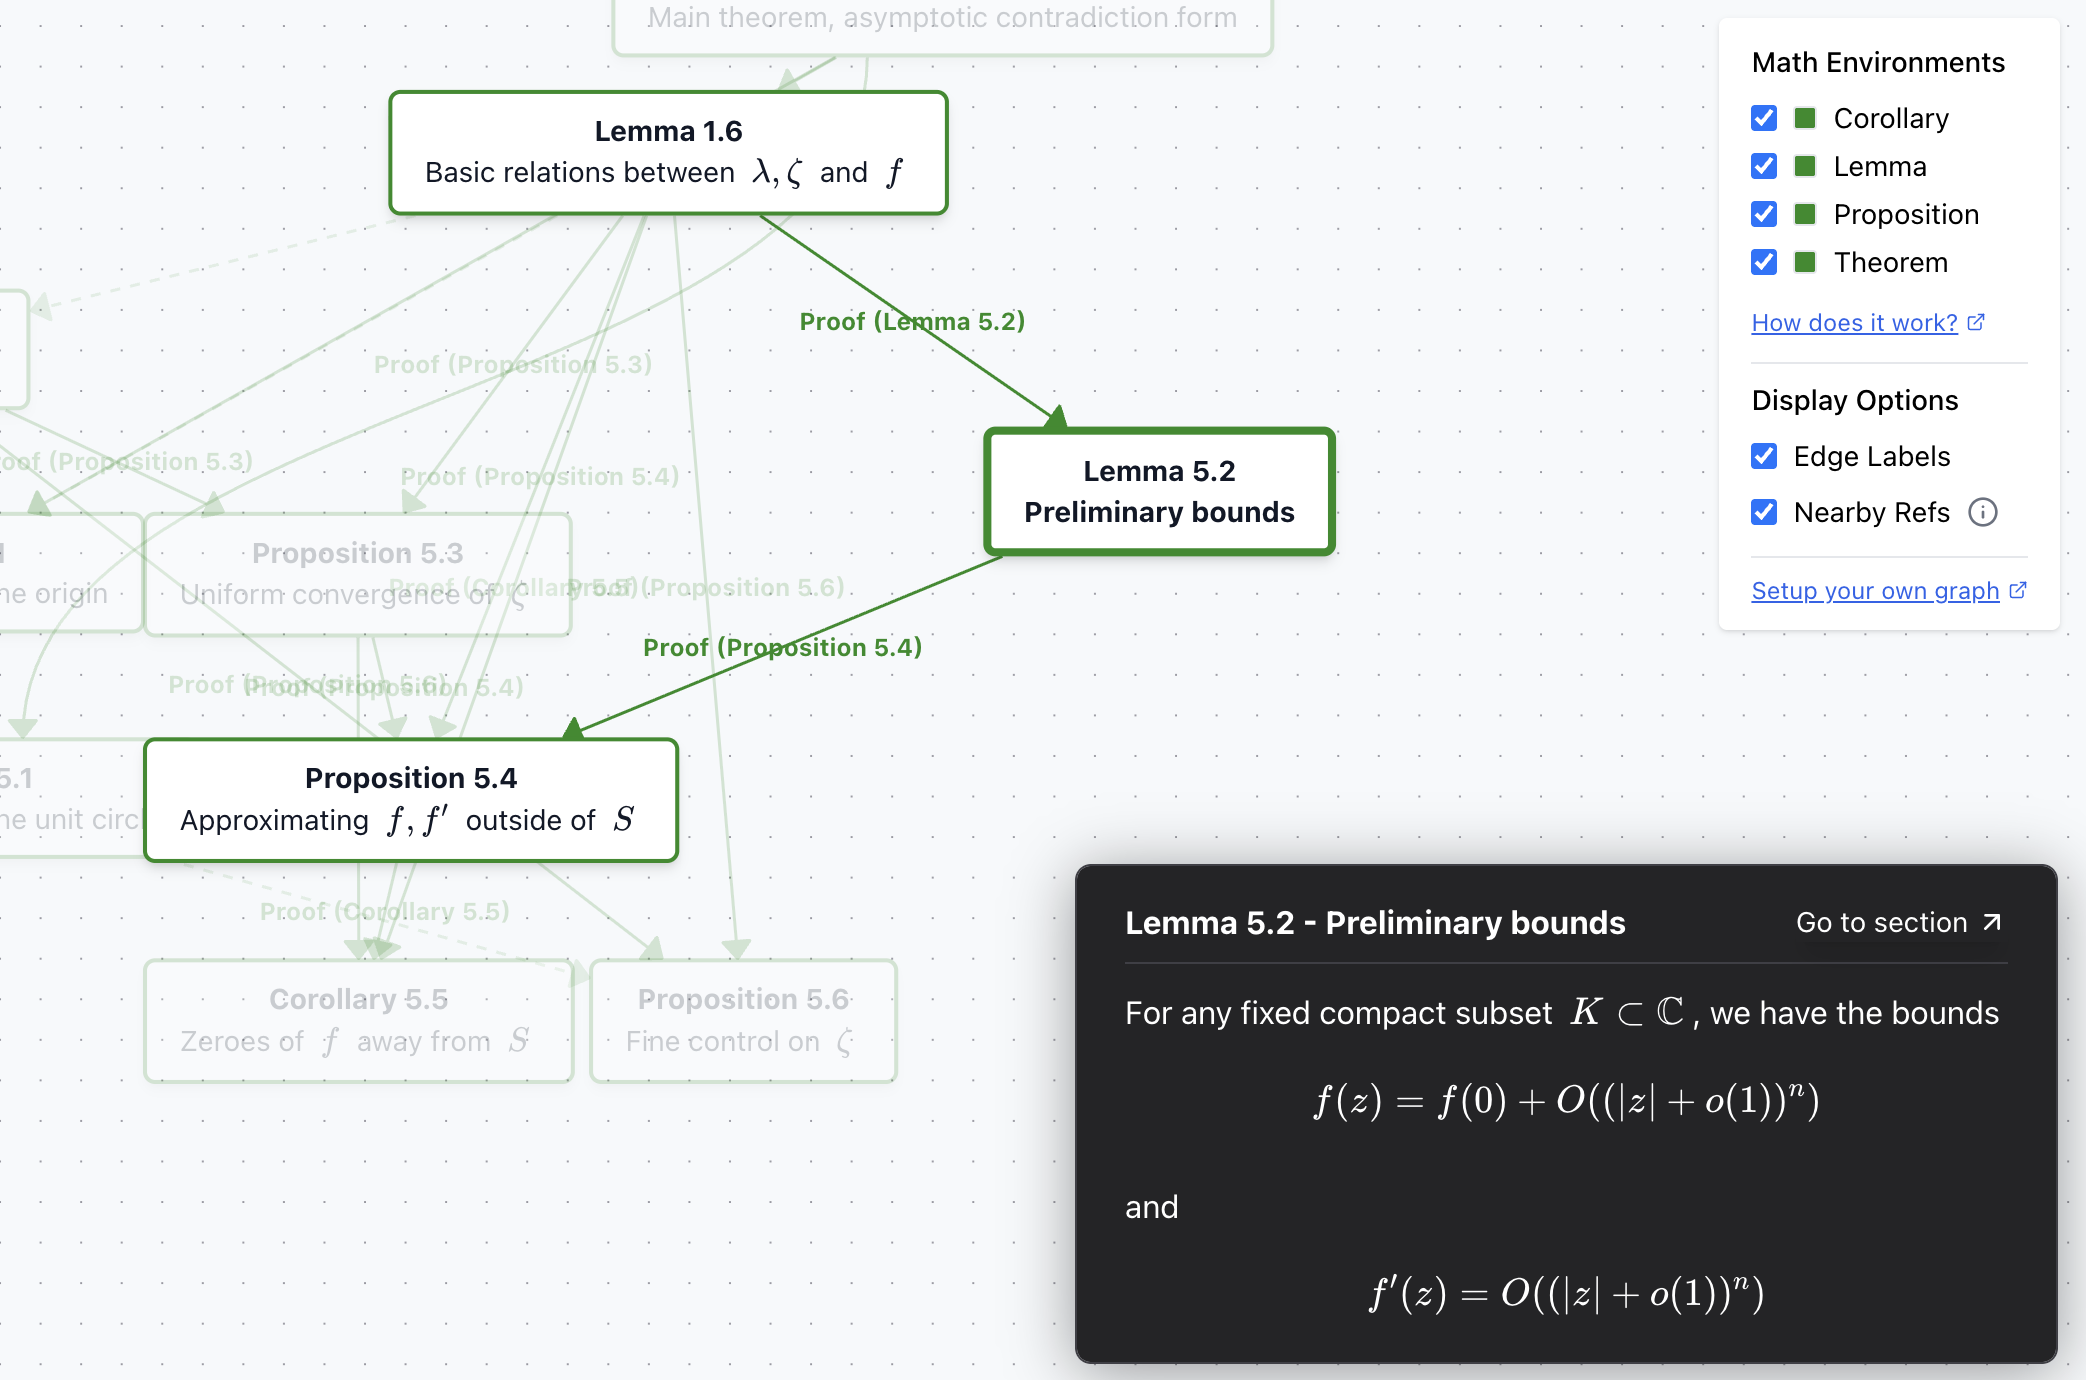
Example graph from the paper "Sendov's conjecture for sufficiently high degree polynomials"
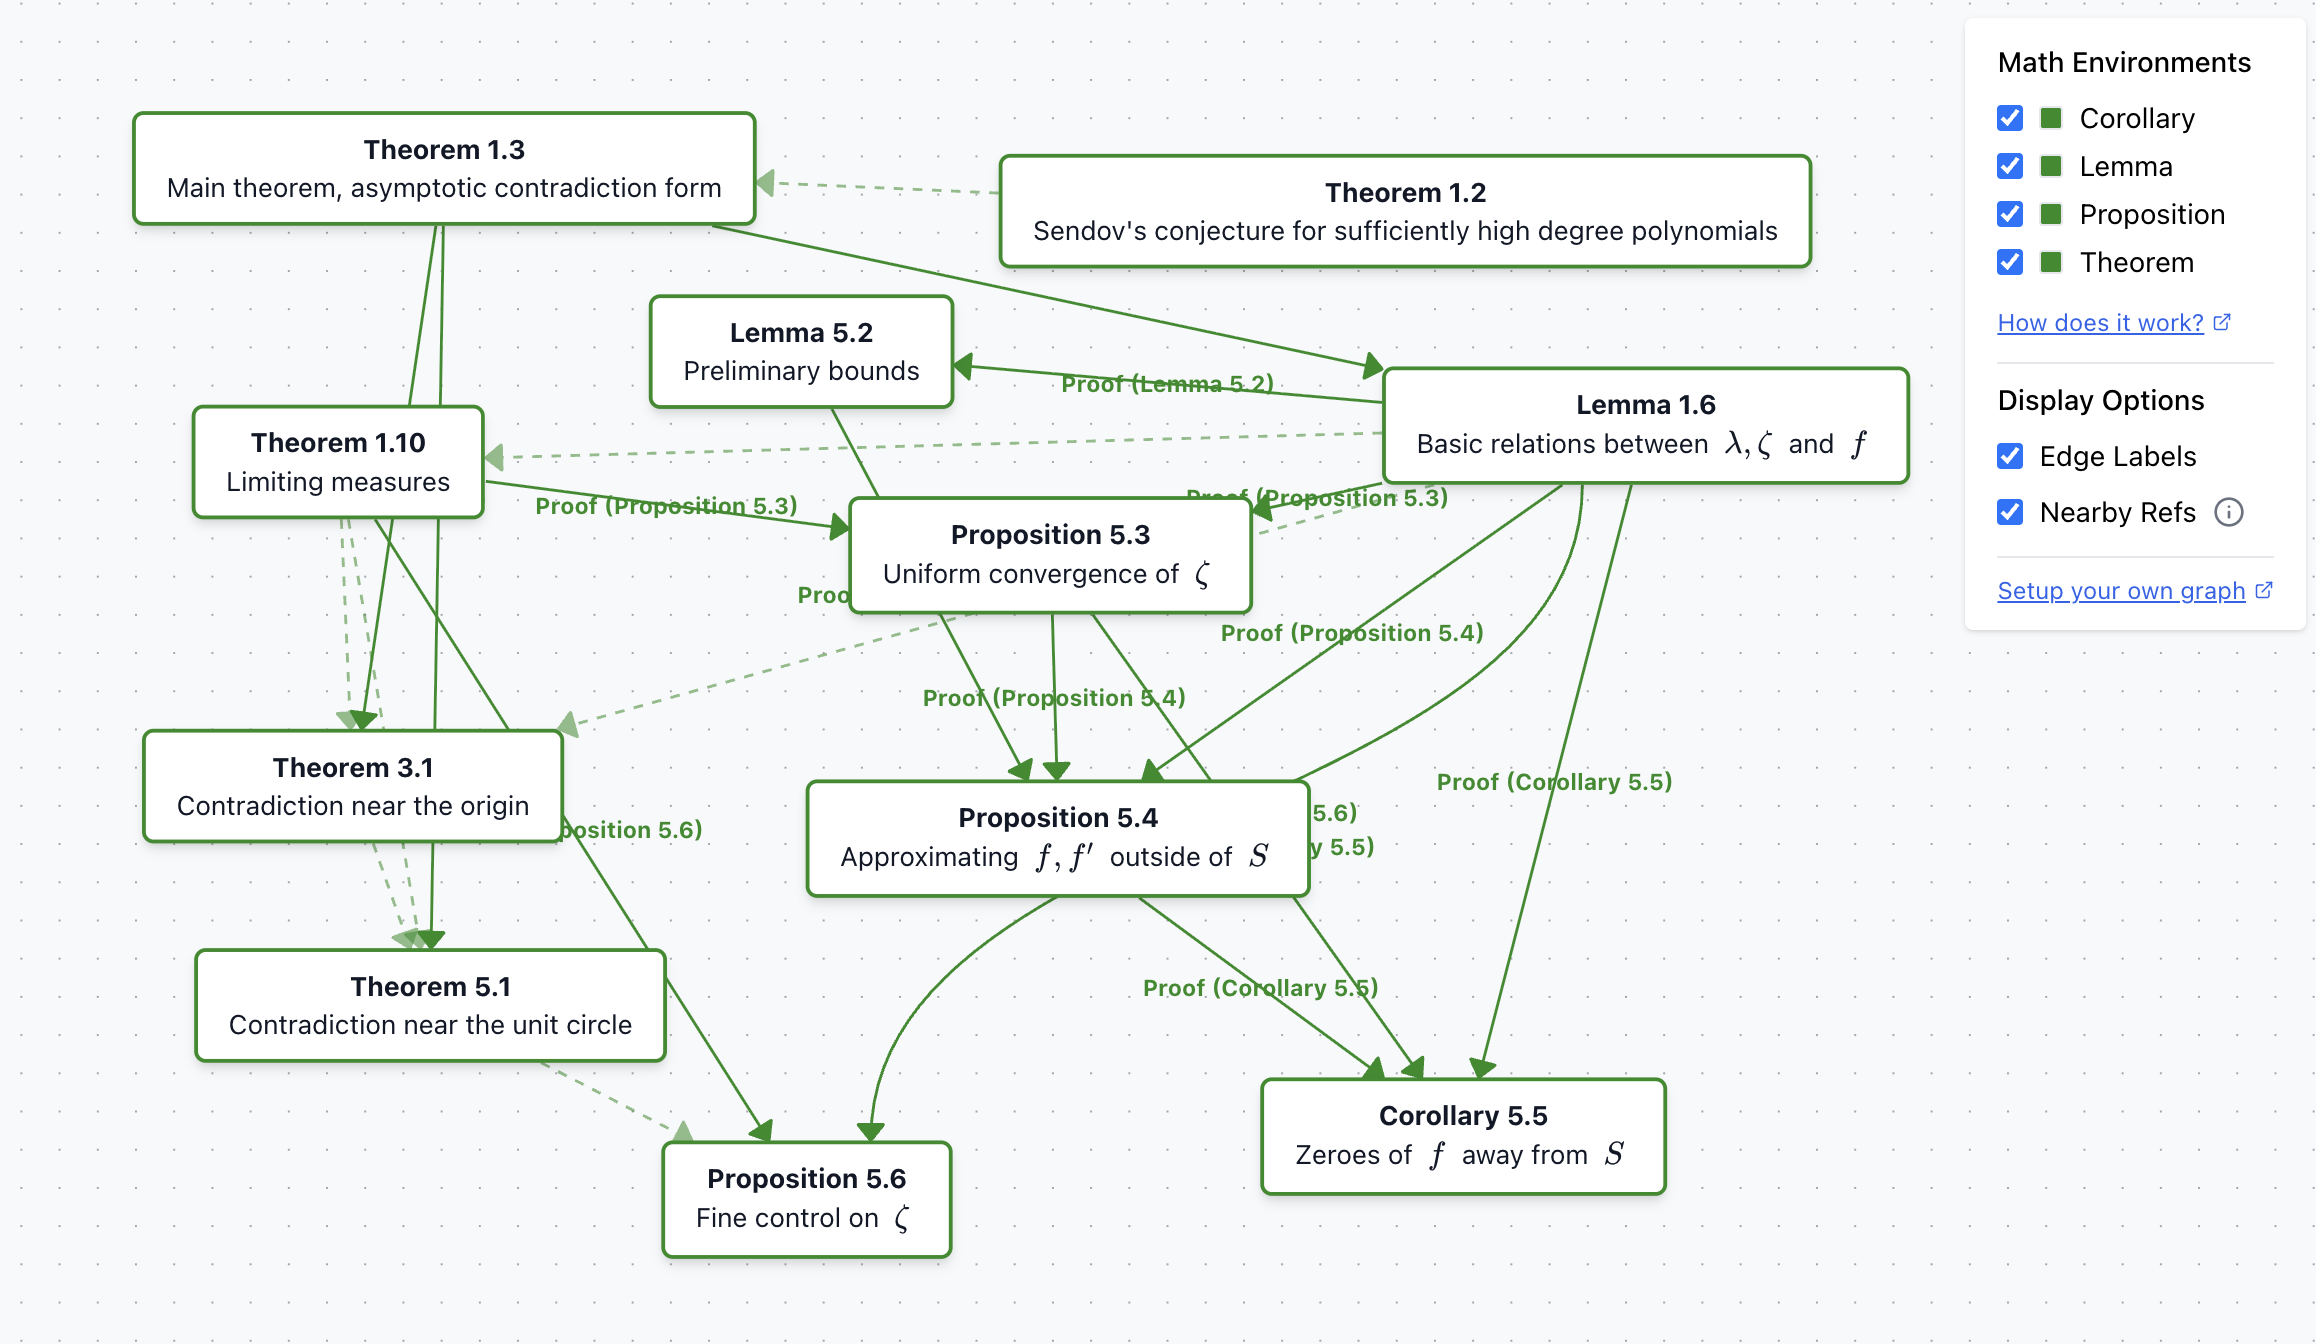
The graph is fully interactive — you can drag nodes around to reorganize the layout and better understand the relationships between mathematical concepts.
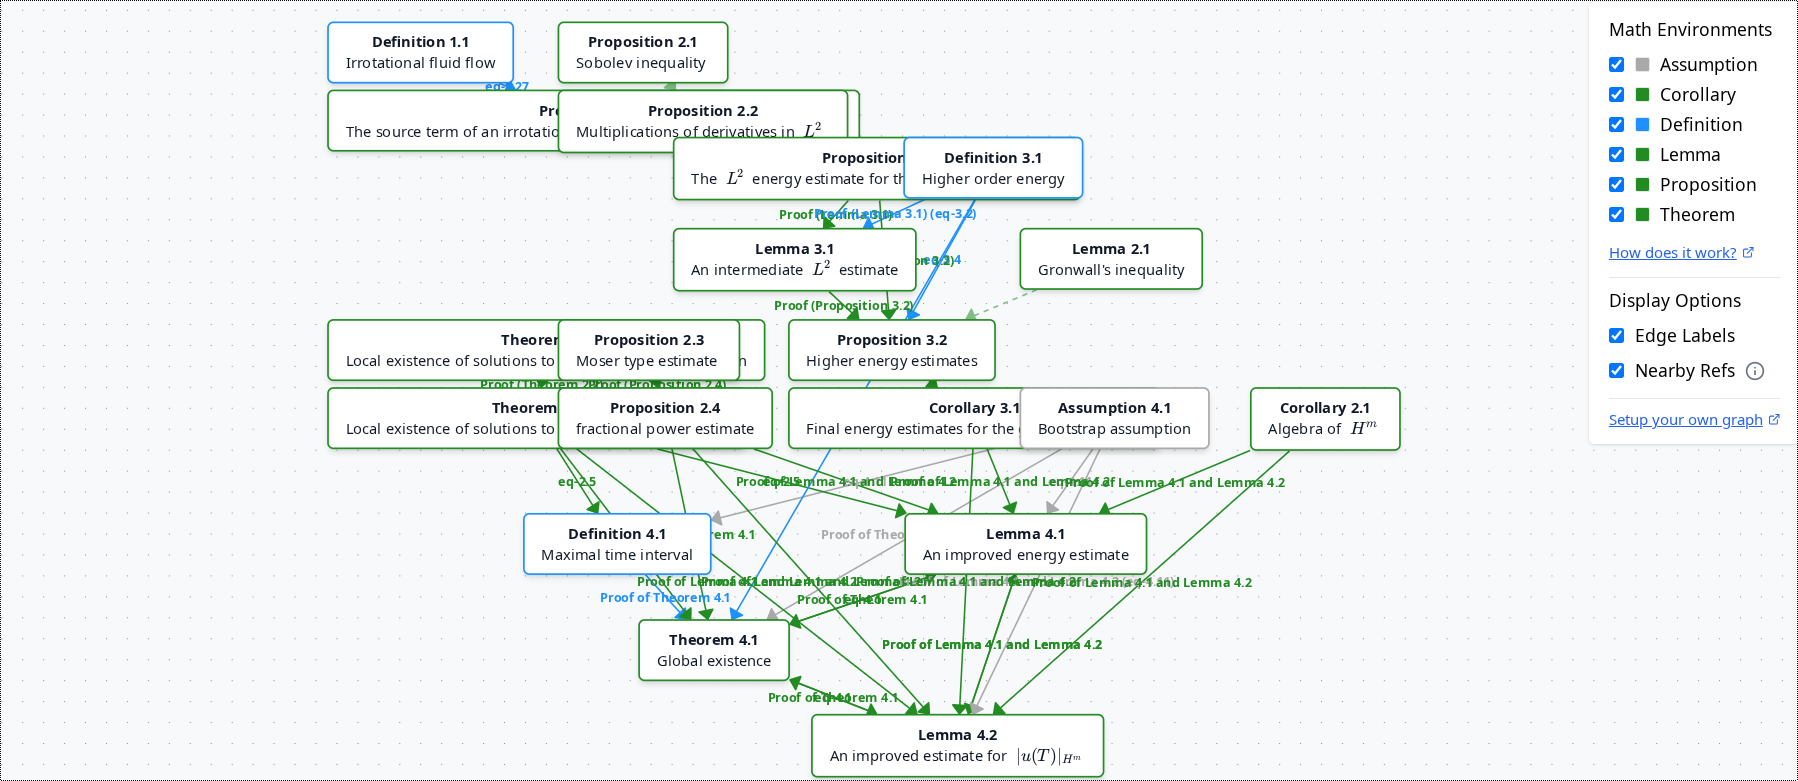
Before
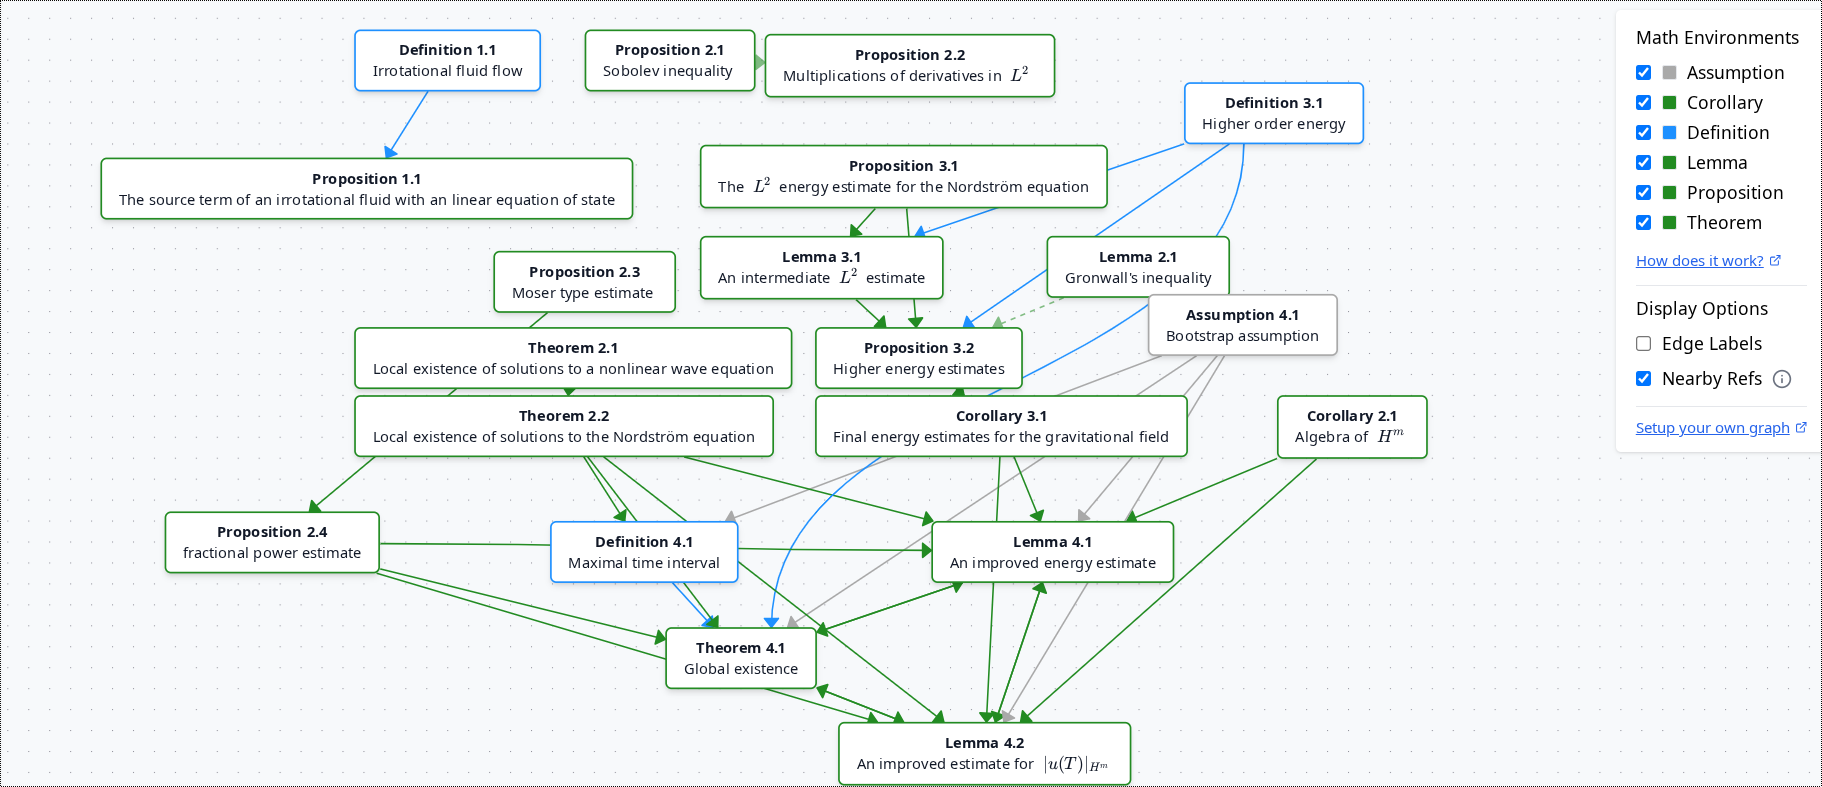
After
How It Works
The system detects connections between \newtheorem blocks and references, then visualizes them in an interactive graph.
Supports direct references, proofs, section references, equations, and nearby references.
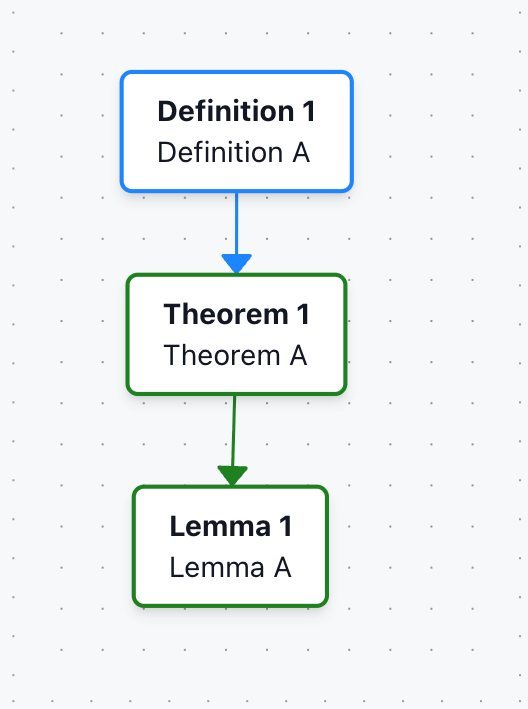
Example 1: Direct links
\newtheorem{thm}{Theorem}
\newtheorem{lem}{Lemma}
\newtheorem{defn}{Definition}

\begin{defn}[Definition A]
\label{defn:a}
\end{defn}

\begin{thm}[Theorem A]
\label{thm:a}
We need \ref{defn:a} to formulate the theorem
\end{thm}

\begin{lem}[Lemma A]
\label{lem:a}
Link to \ref{thm:a}
\end{lem}
How it looks:
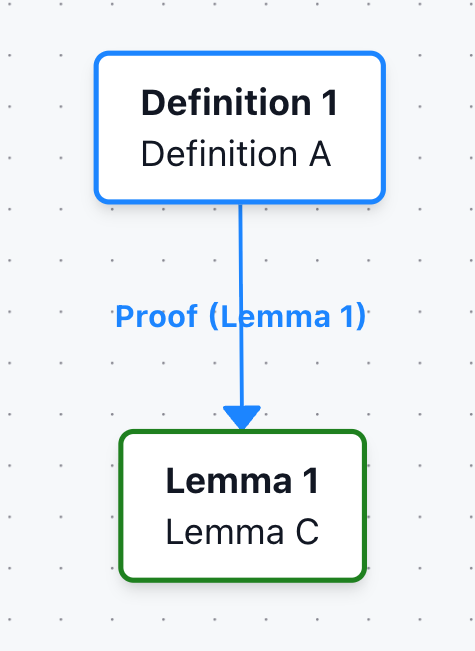
Example 2: Proof blocks
The graph also works with \begin{proof} that immediately follows a newtheorem block (that is not a remark or example).
It associates this proof block with the preceding newtheorem block.
\newtheorem{lem}{Lemma}
\newtheorem{def}{Definition}

\begin{def}[Definition A]
\label{def-a}
\end{def}

\begin{lem}[Lemma C]
\label{lemma-c}
\end{lem}

Let us now examine the proof
\begin{proof}
% Proof is associated with Lemma C, since it is directly after it
Uses Definition A \ref{def-a}
\end{proof}
How it looks:
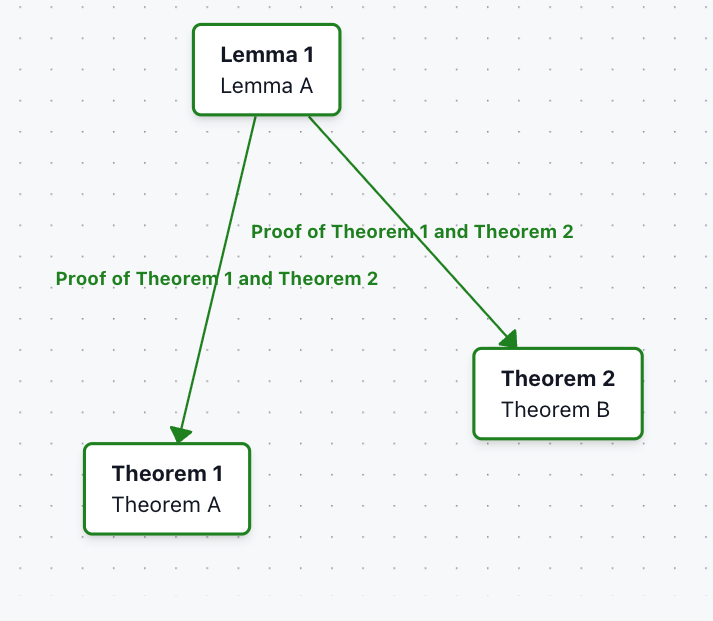
Example 3: Sections, paragraphs with refs
Links can also be established for newtheorem blocks referenced inside \section etc
Tip: Works on any \section \subsection \subsubsection \paragraph \subparagraph blocks. Also works with asterisk e.g. \section*
\newtheorem{thm}{Theorem}
\newtheorem{lem}{Lemma}

\begin{thm}[Theorem A]
\label{thm:a}
\end{thm}

\begin{lem}[Lemma A]
\label{lem:a}
\end{lem}

\begin{thm}[Theorem B]
\label{thm:b}
\end{thm}

\subsection*{Proof of \ref{thm:a} and \ref{thm:b}}
Lemma A \ref{lem:a} creates a link to Theorem A and Theorem B.
How it looks:
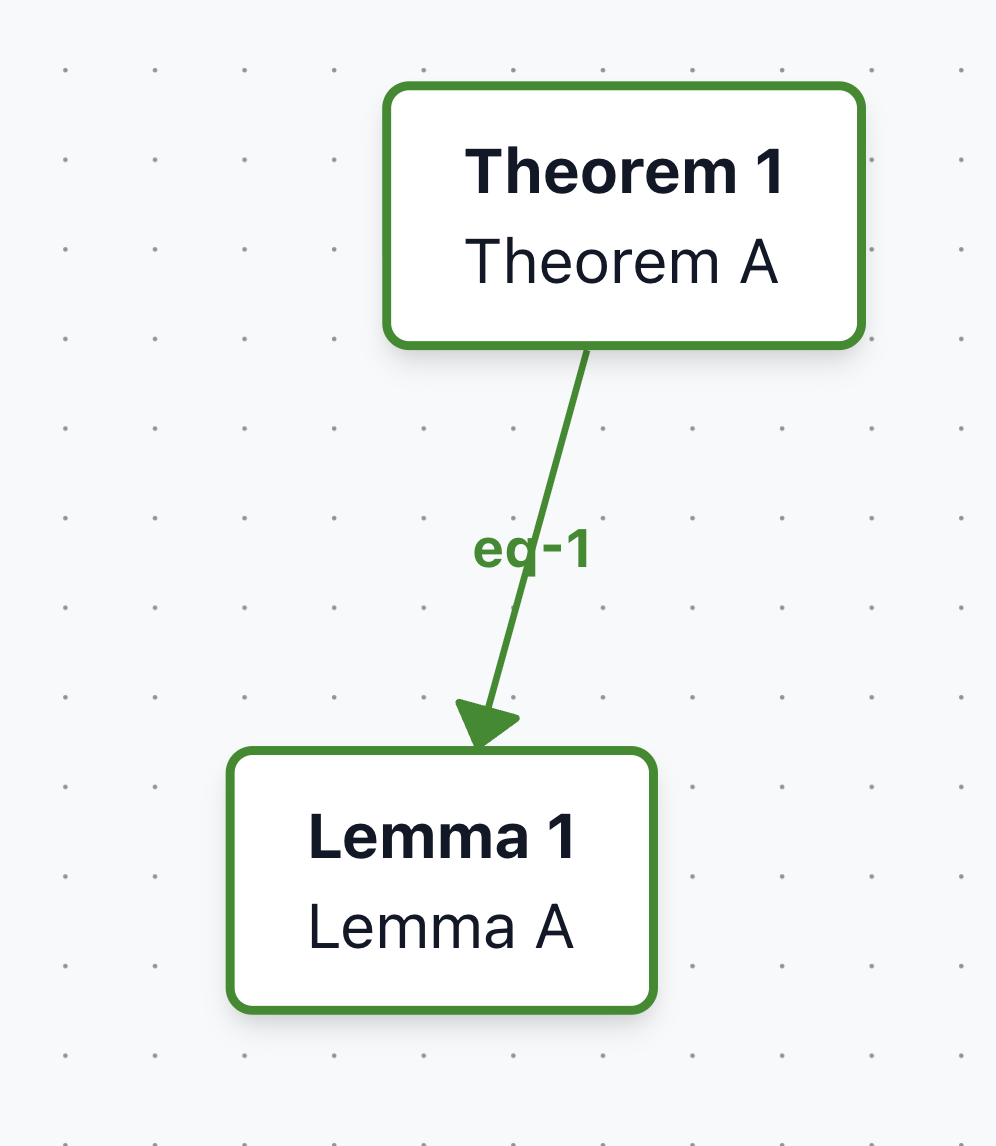
Example 4: Linking by equations
References to equations nested inside newtheorem environments can also be linked. These links/edges will be labelled as “eq-number”, where number is the number of the equation within the document.
\newtheorem{lem}{Lemma}
\newtheorem{thm}{Theorem}

% Theorem
\begin{thm}[Theorem A]
\label{thm-a}

\begin{equation}\label{eq-a}
1+1
\end{equation}
\end{thm}

% Lemma
\begin{lem}[Lemma A]
\label{lem-a}

Referencing equation \ref{eq-a}, will link Lemma A to Theorem A
\end{lem}
How it looks:
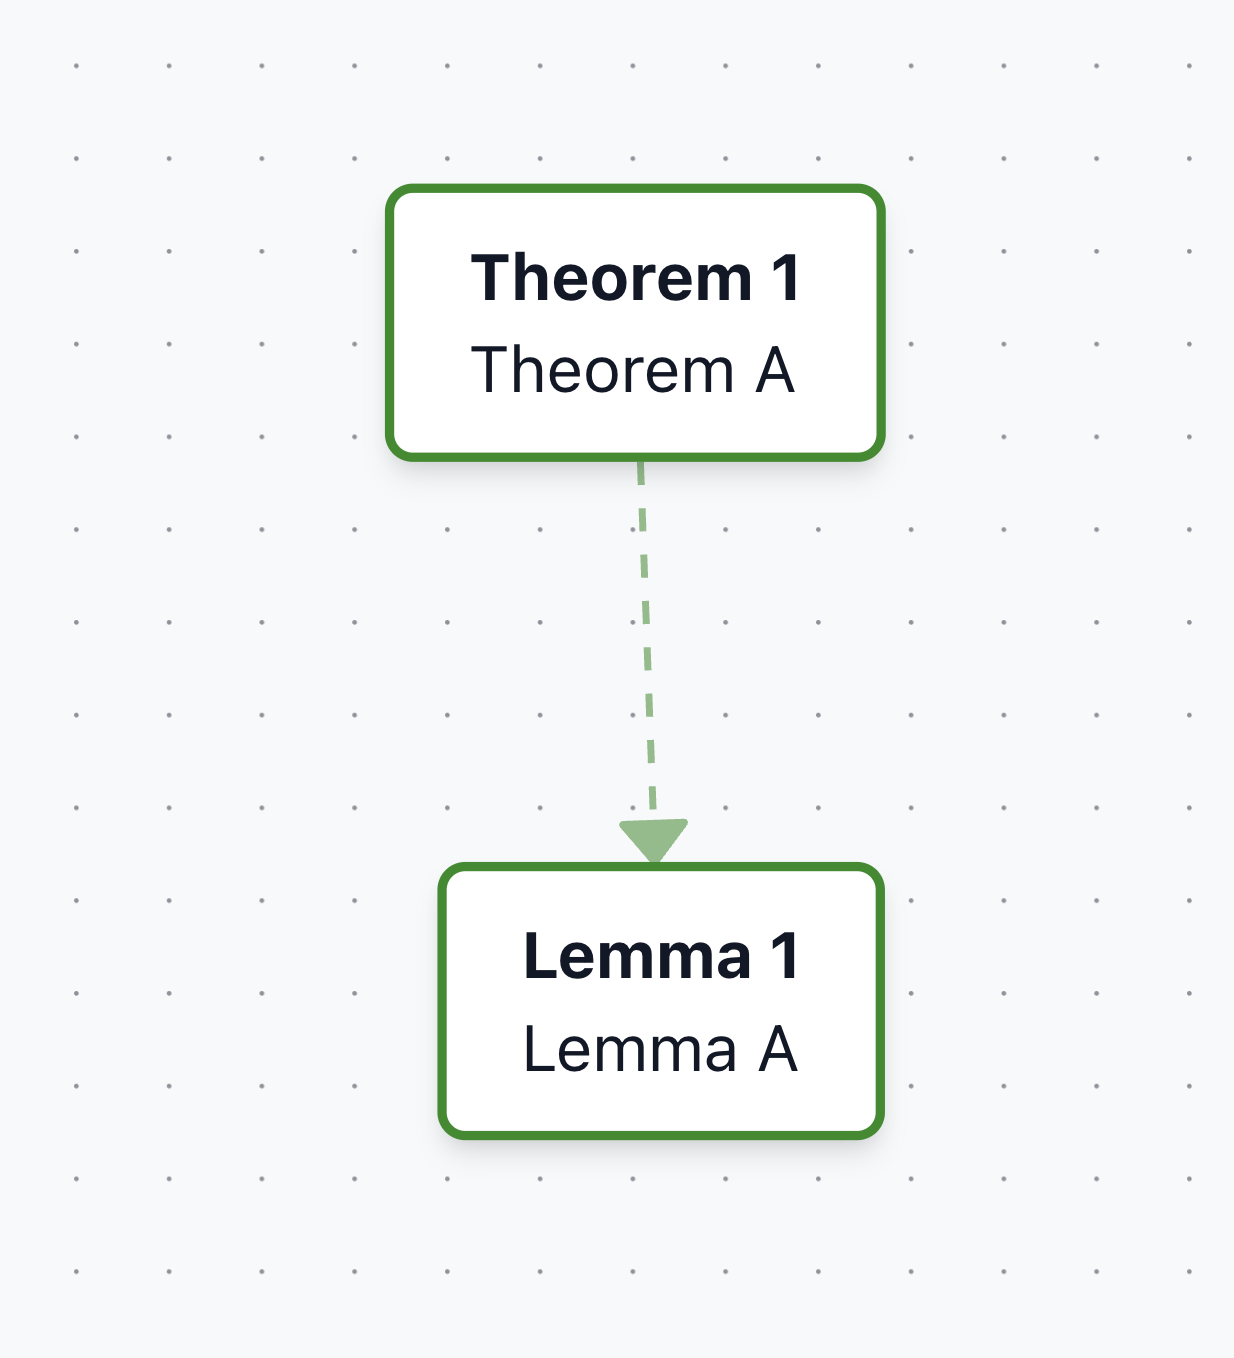
Example 5: Indirect links (“nearby refs”)
Sometimes, references could appear immediately outside a newtheorem block. In ScienceStack, these indirect references are called “nearby refs”, which are references detected right after the math block, typically in follow-up explanatory text.
These links are dotted i.e. indirect, and can be toggled on/off in the panel “Nearby refs”
\newtheorem{lem}{Lemma}
\newtheorem{thm}{Theorem}

% Theorem
\begin{thm}[Theorem A]
\label{thm-a}
\end{thm}

% Lemma
\begin{lem}[Lemma A]
\label{lem-a}
\end{lem}

The previous lemma indirectly references theorem A via \ref{thm-a}, while being outside of the theorem environment.
How it looks:
Interface
Panel
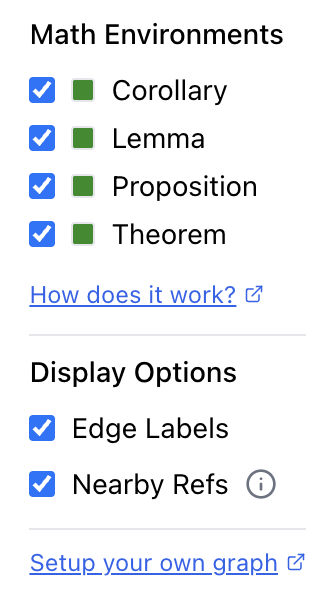
The graph interface includes a control panel on the right side that lets you customize the visualization:
- Math Environments: Filter which types of mathematical objects to display (assumptions, corollaries, lemmas, propositions, theorems)
- Display Options: Toggle edge labels and nearby references on/off
Interactive UI
The dependency graph supports interactive exploration:
- Hover: Move your cursor over any node to highlight its connections and see related theorems
- Click to Pin: Click on a node to pin it, keeping the node and its dependencies highlighted even when you move your cursor away
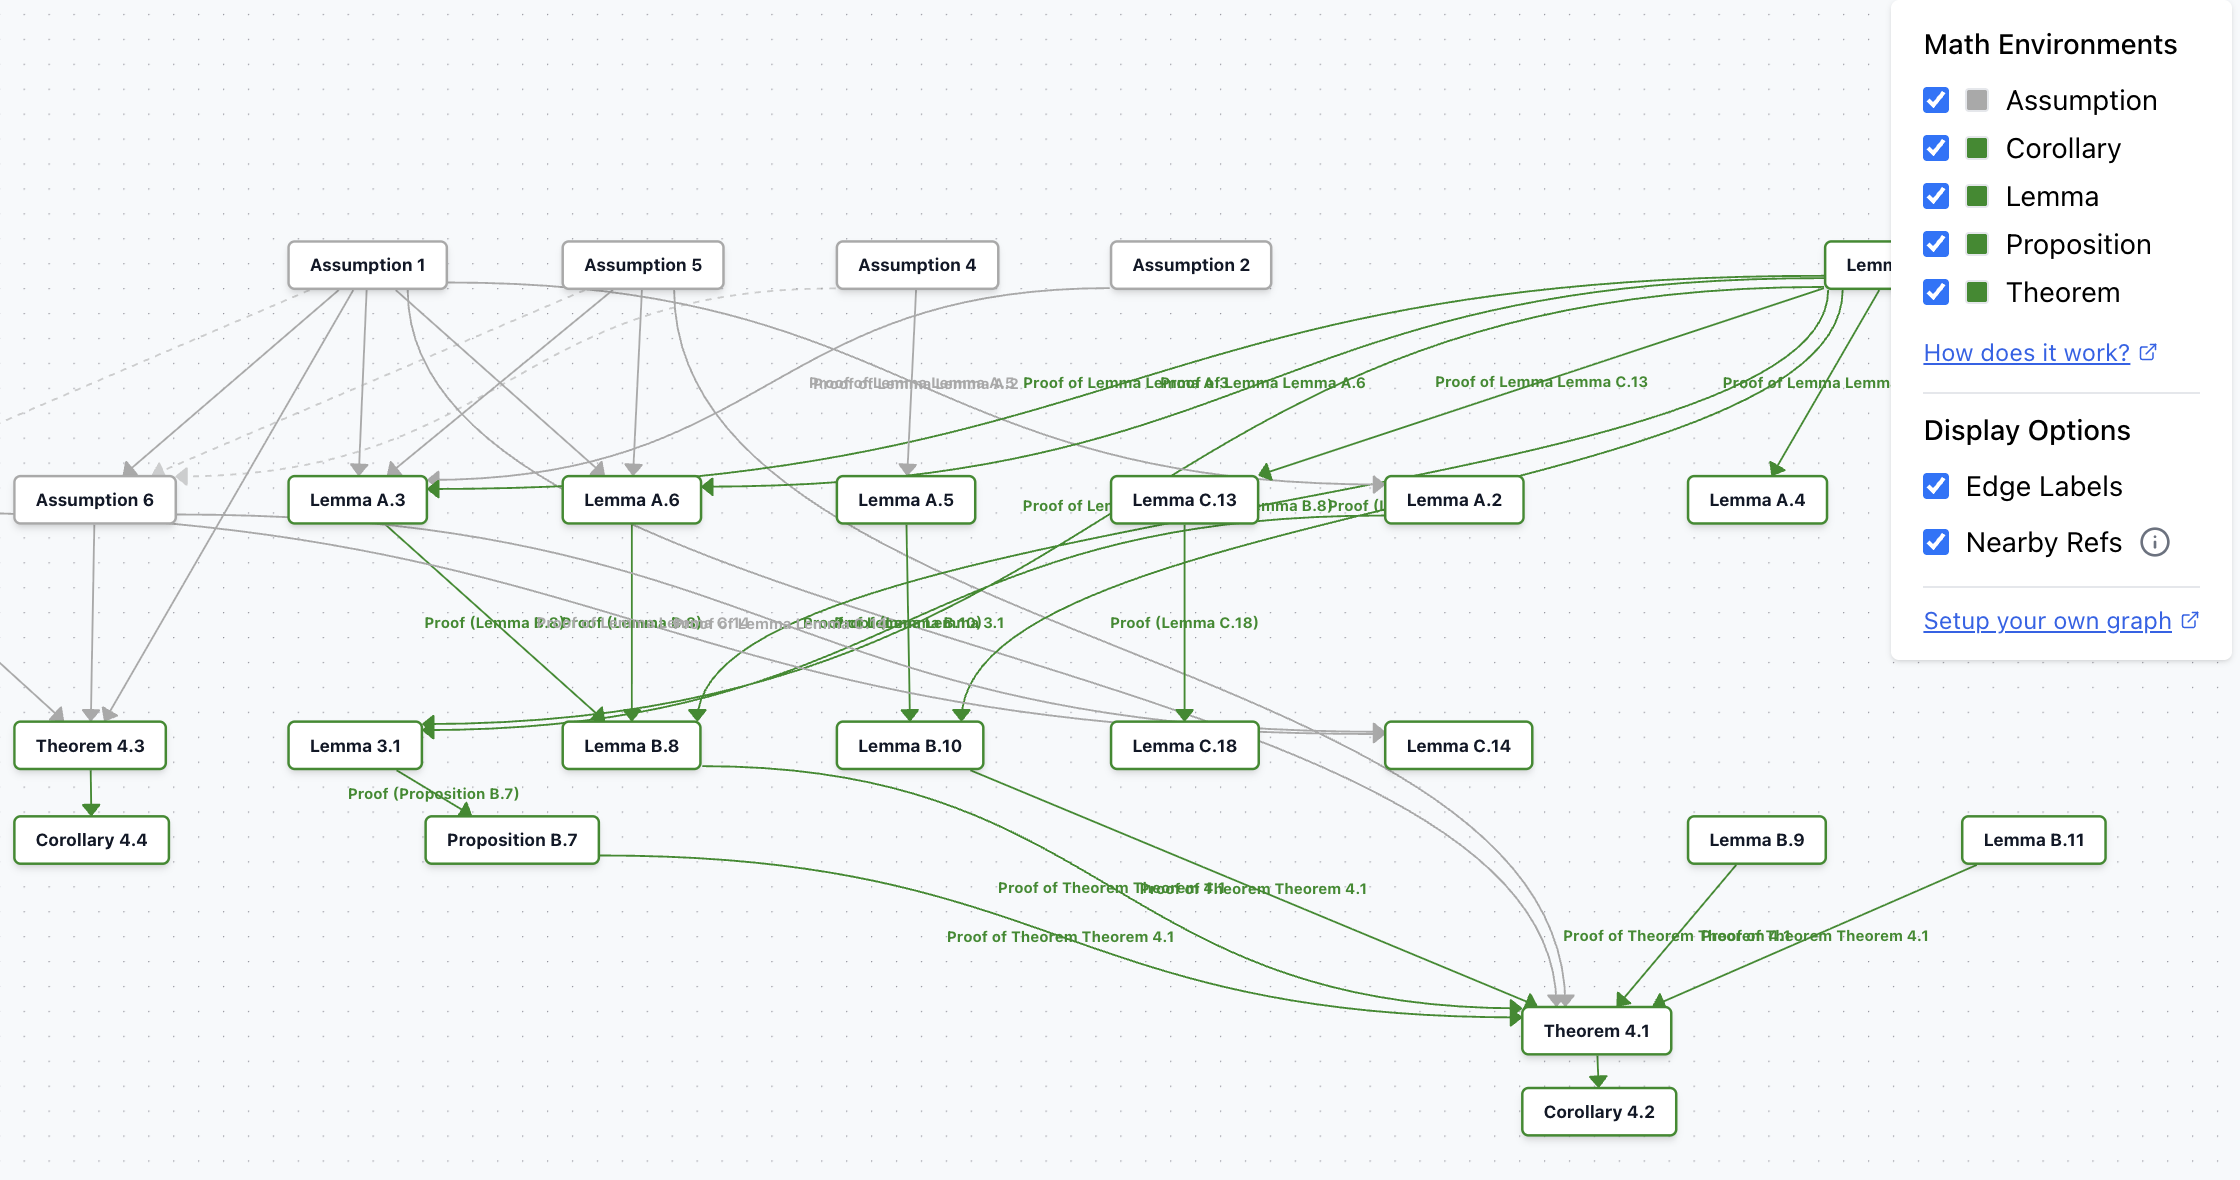
Color Coding
The graph uses a consistent color scheme to distinguish different types of mathematical objects:
-
Forest Green: Used for core mathematical statements (theorems, lemmas, corollaries, propositions) that form the logical backbone of the paper. Forest-Green color follows the Lean4 project convention established in the Lean4 PFR project.
-
Other Colors: Different newtheorem environments may use different colors for clarity, usually gray e.g. assumptions/examples/remarks
Creating Your Own Dependency Graph
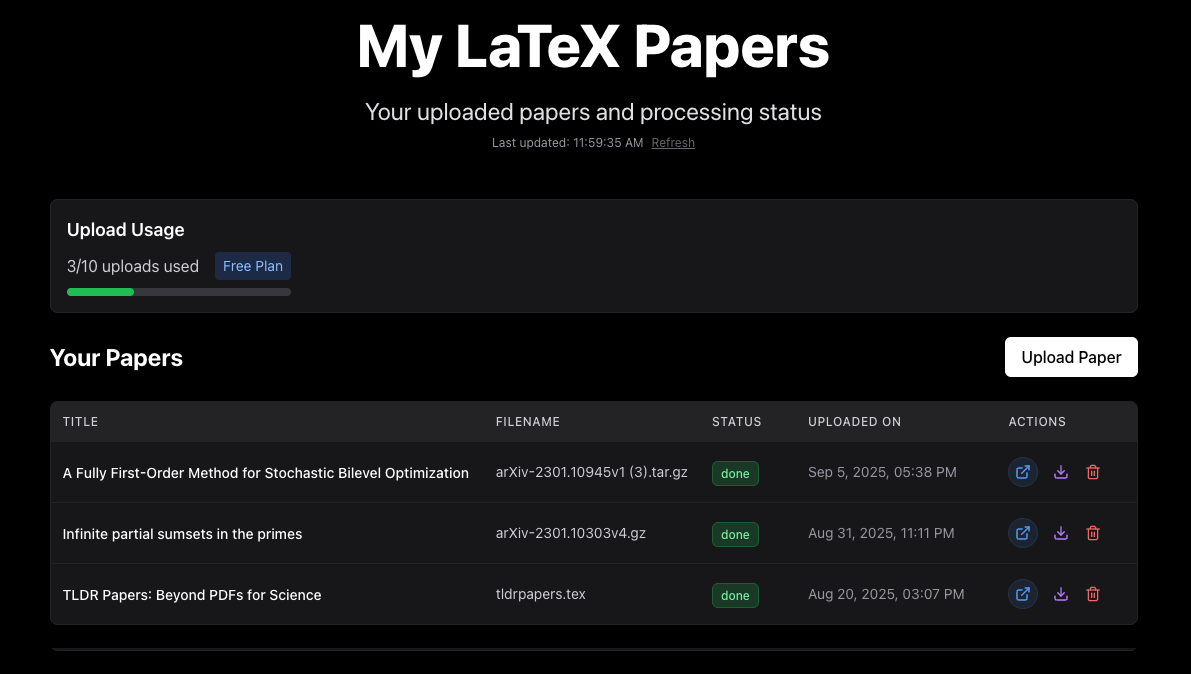
To generate a dependency graph for your own LaTeX paper:
- Upload: Click "My Uploads" and upload your LaTeX source file (supports .tex, .flt, .zip, .gz, and other formats)
- Processing: After uploading, you'll be redirected to your dashboard where the paper will be processed
- View Paper: Once processing is complete, click the blue "View as HTML" button
- Graph Tab: Click on the "Graph" tab at the top to view the dependency graph
The system will automatically detect \newtheorem environments and \ref{}/\label{} commands to build the dependency relationships.
FAQ
How do I export the graph?
Graph export is not currently supported. If this is critical for your use case, please reach out to support@sciencestack.ai.
The graph creates connections based on \ref and \label, which could lead to a very large graph. How do I create a custom/smaller graph?
Custom graphs are not yet supported. One possible workaround is to enforce naming conventions or suffixes in your LaTeX (e.g. \ref{thm:one:graph}) and then filter by those patterns. This would allow generating a reduced graph without additional packages, but the feature isn't built into the UI yet.
We are talking with some researchers on building this feature. If this is important, you may reach out to support@sciencestack.ai for a closed beta.