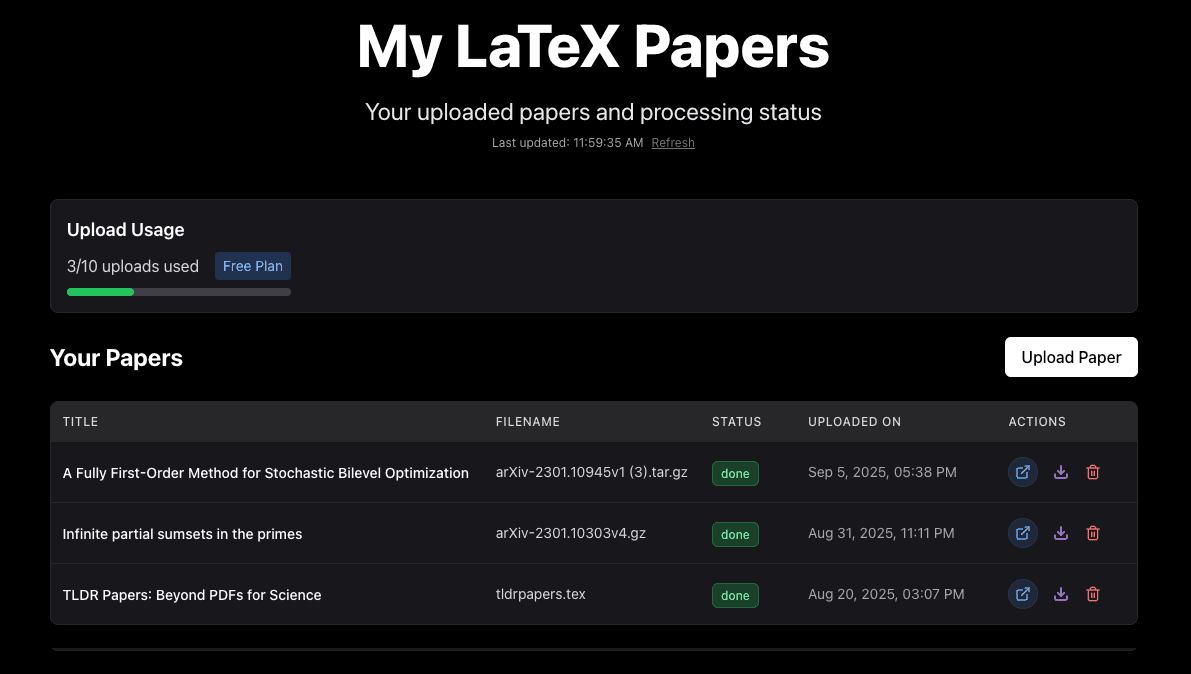
Dependency Graphs
ScienceStack automatically generates math dependency graphs directly from LaTeX source files. The process is fully automated — no custom packages required — and works with simple \ref and \label commands.
This was inspired by Terence Tao's blog post Would it be possible to create a tool to automatically diagram papers?.
Example graph from the paper "Sendov's conjecture for sufficiently high degree polynomials"
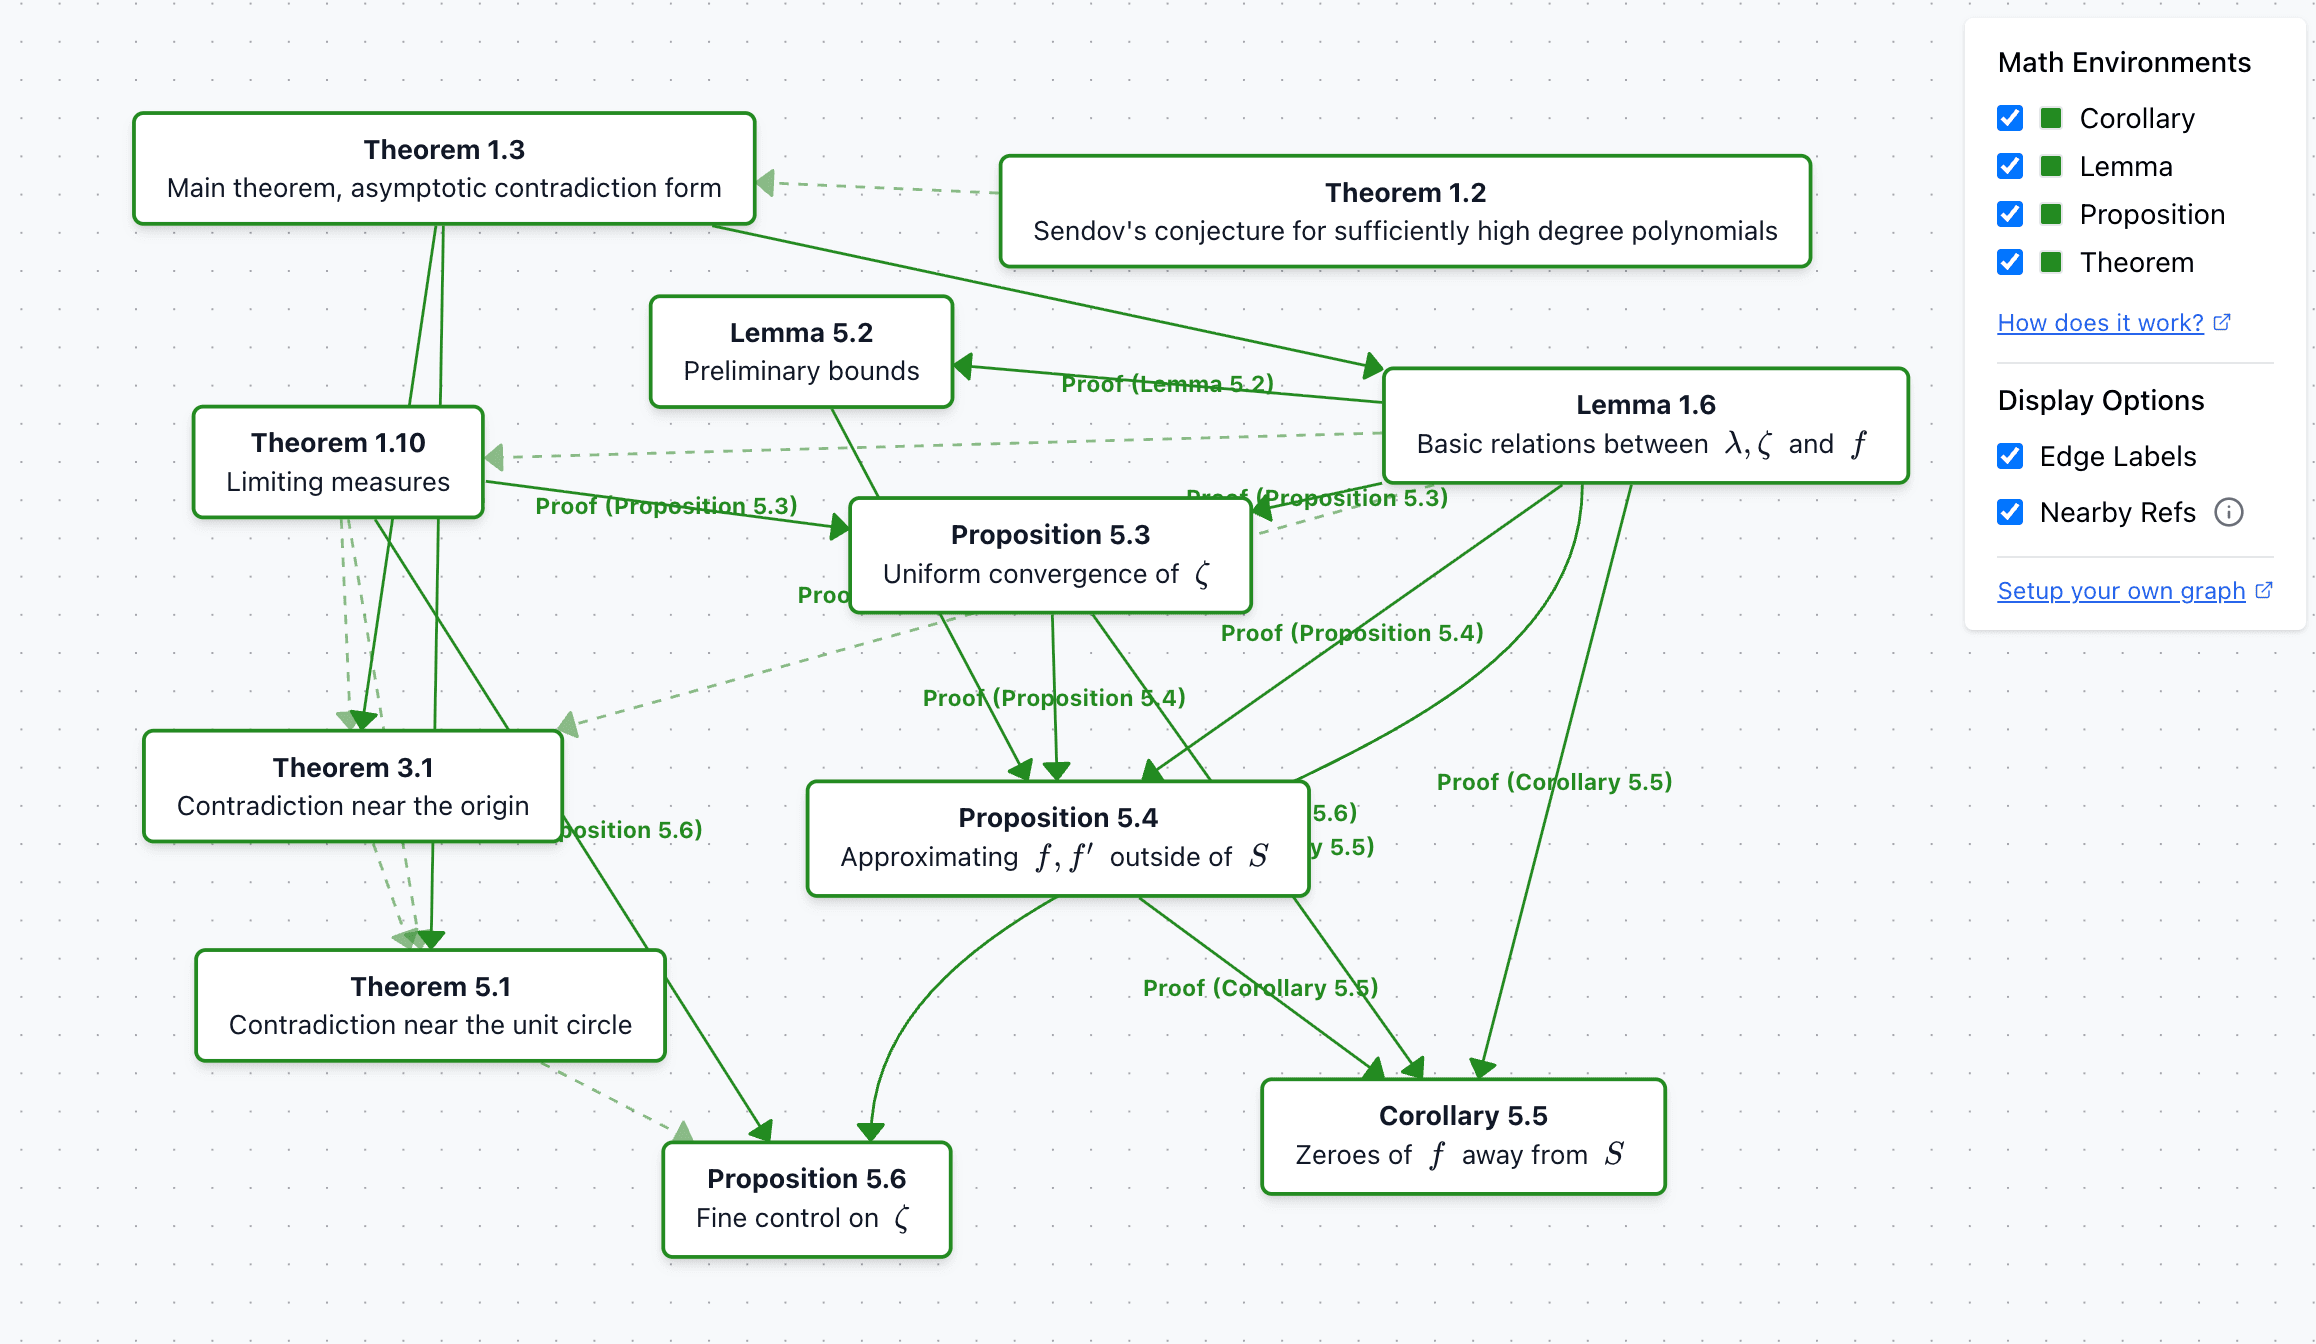
The graph is fully interactive — you can drag nodes around to reorganize the layout and better understand the relationships between mathematical concepts.
| Before | After |
|---|---|
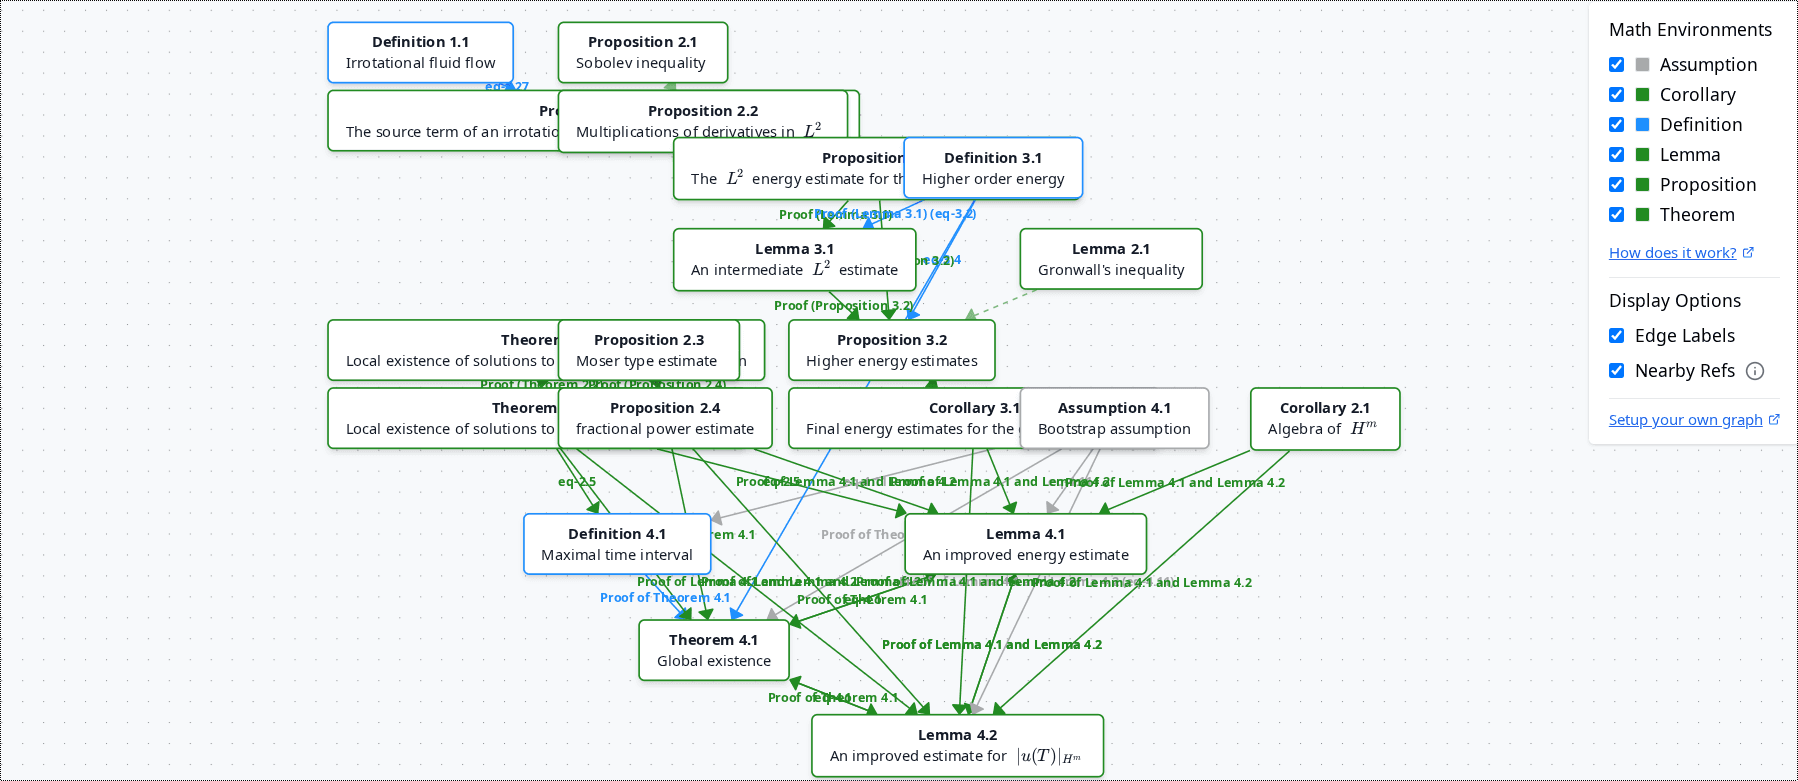 | 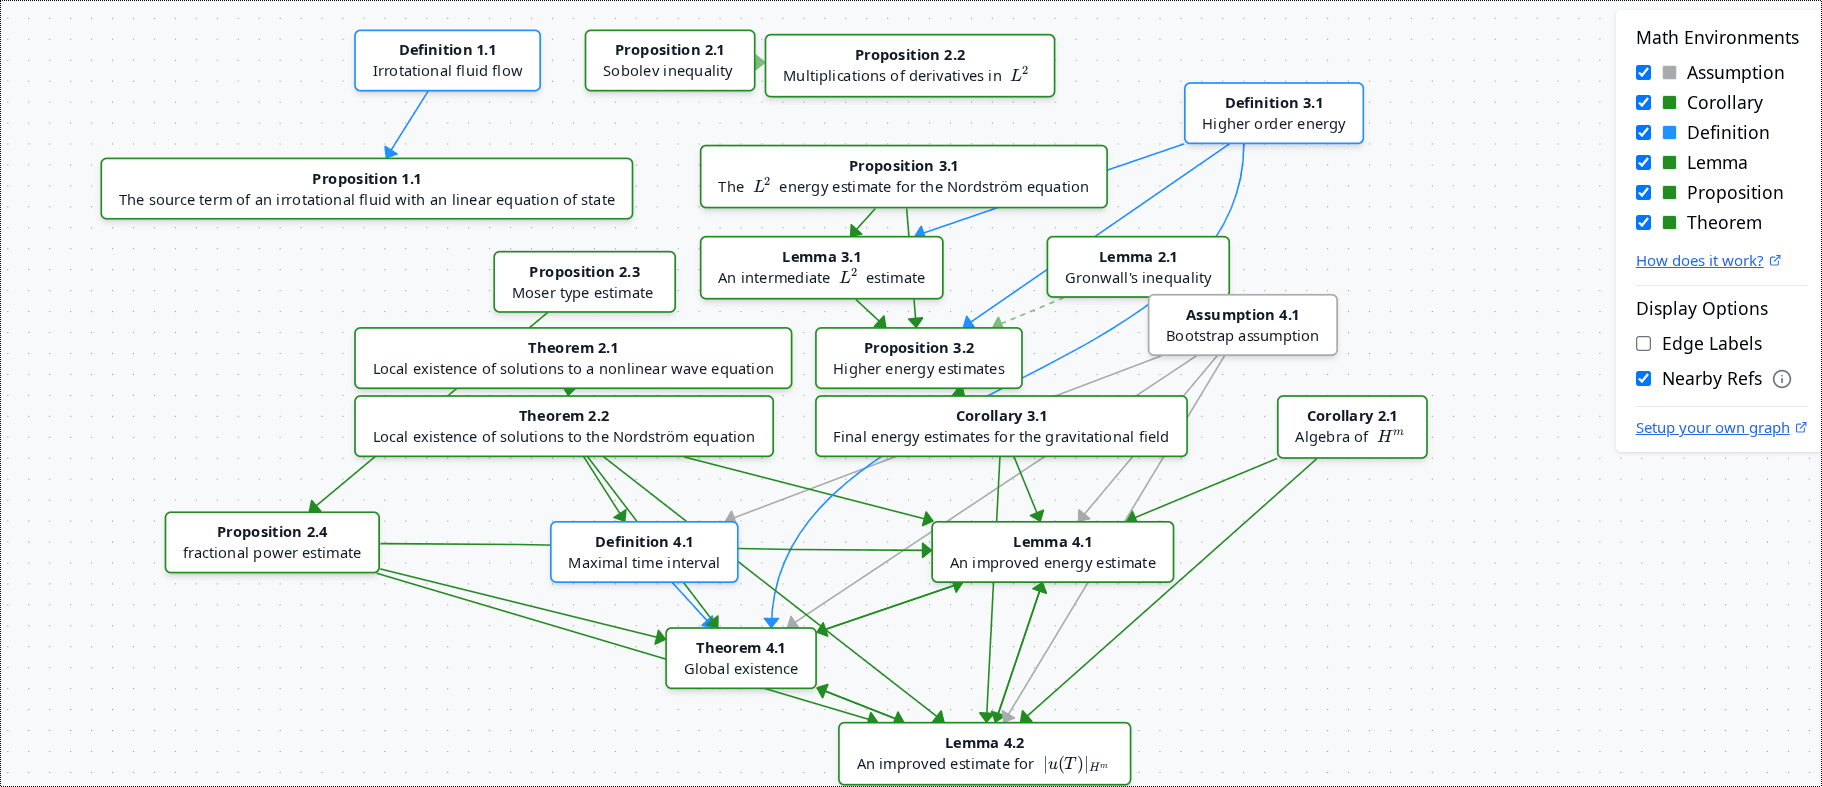 |
How It Works
The system detects connections between \newtheorem blocks and references, then visualizes them in an interactive graph. Supports direct references, proofs, section references, equations, and nearby references.
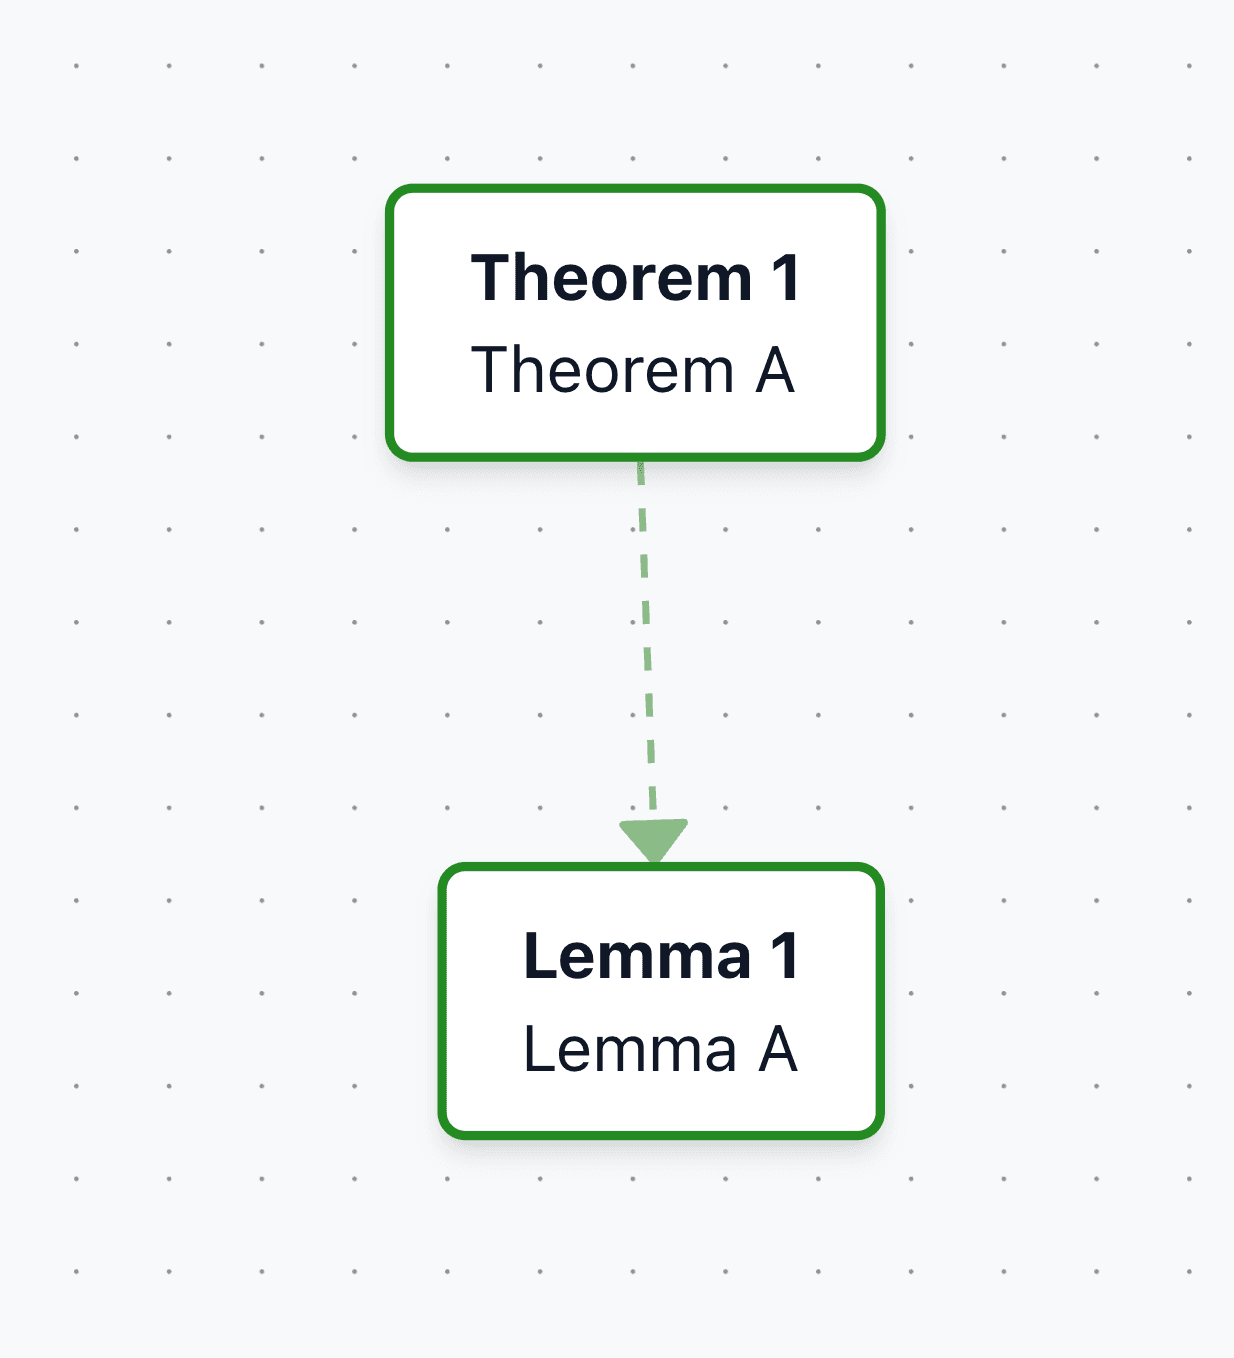
Example 1: Direct links
\newtheorem{thm}{Theorem}
\newtheorem{lem}{Lemma}
\newtheorem{defn}{Definition}

\begin{defn}[Definition A]
\label{defn:a}
\end{defn}

\begin{thm}[Theorem A]
\label{thm:a}
We need \ref{defn:a} to formulate the theorem
\end{thm}

\begin{lem}[Lemma A]
\label{lem:a}
Link to \ref{thm:a}
\end{lem}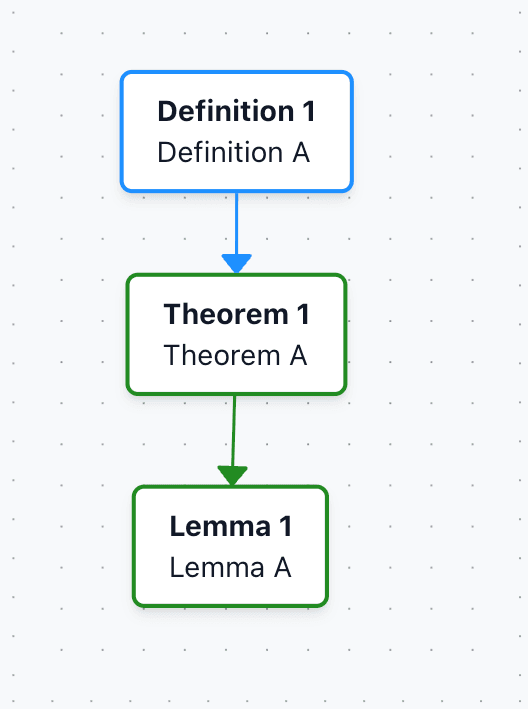
Example 2: Proof blocks
The graph also works with \begin{proof} that immediately follows a newtheorem block (that is not a remark or example).
\begin{lem}[Lemma C]
\label{lemma-c}
\end{lem}

\begin{proof}
% Proof is associated with Lemma C
Uses Definition A \ref{def-a}
\end{proof}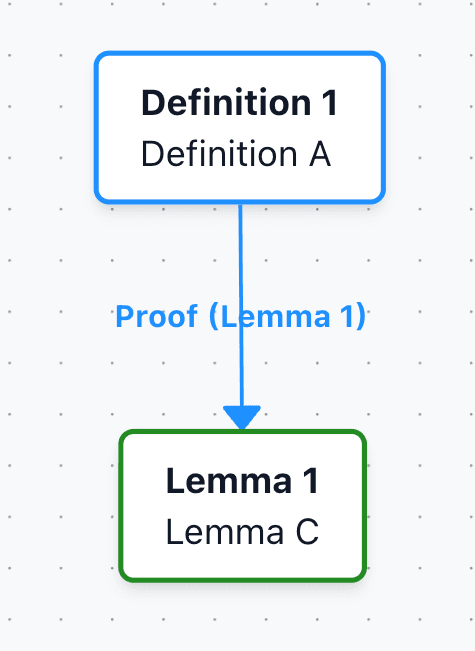
Example 3: Sections with refs
Links can also be established for newtheorem blocks referenced inside \section, \subsection, etc.
\subsection*{Proof of \ref{thm:a} and \ref{thm:b}}
Lemma A \ref{lem:a} creates a link to Theorem A and Theorem B.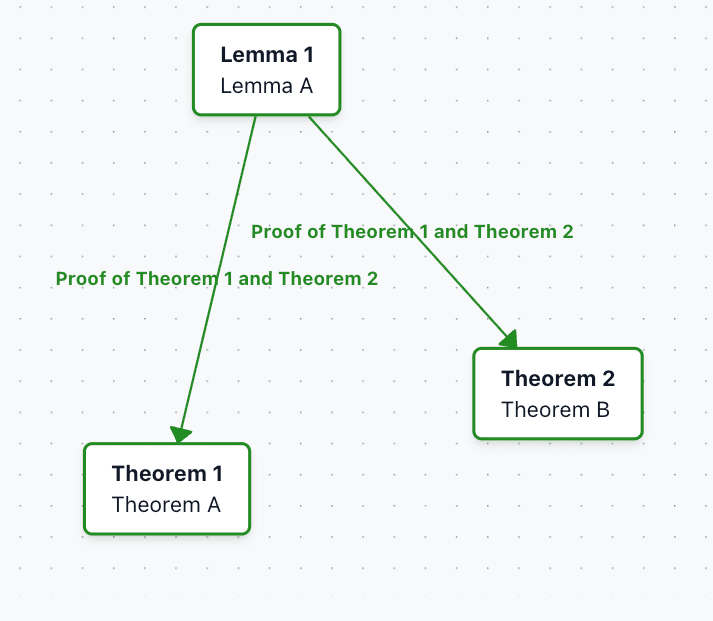
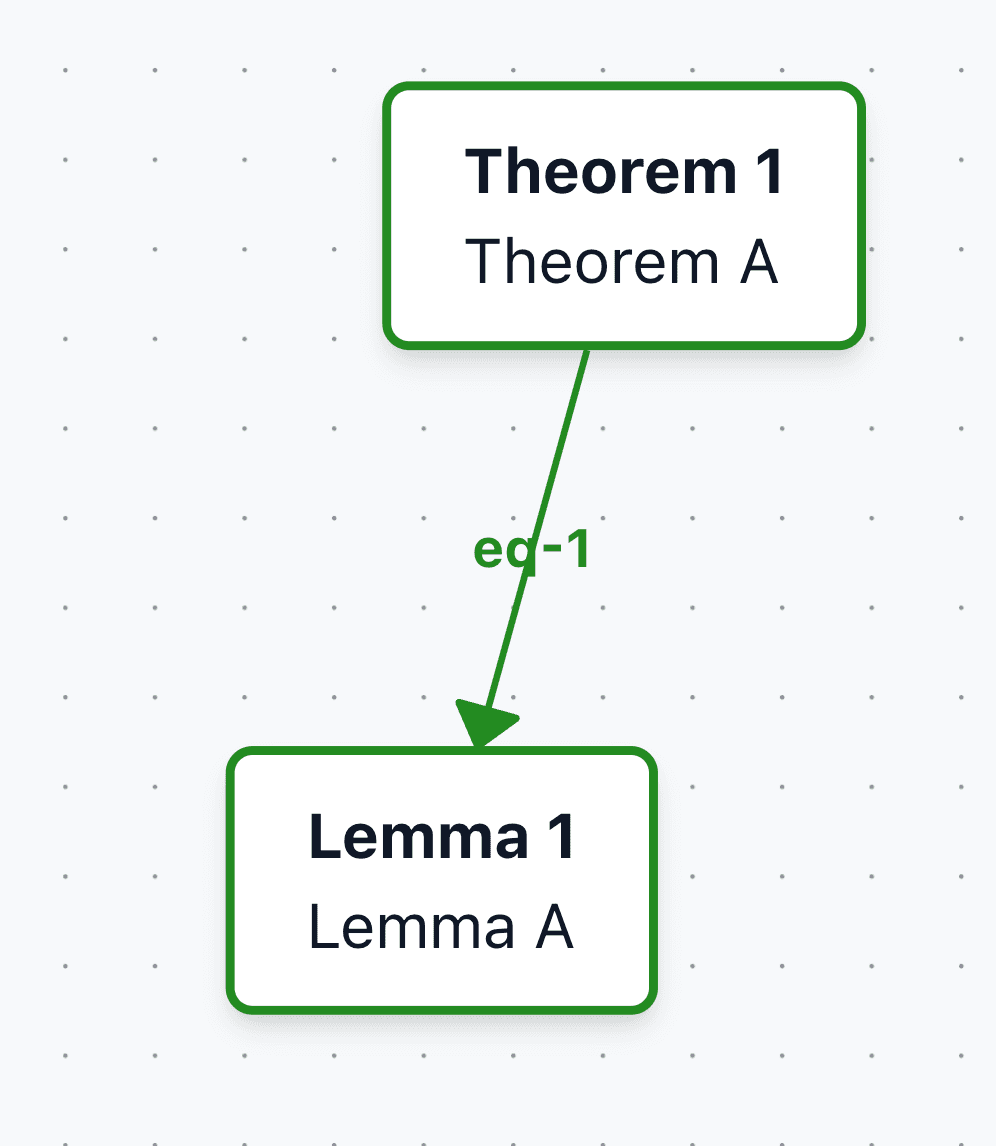
Example 4: Linking by equations
References to equations nested inside newtheorem environments can also be linked.
Example 5: Indirect links ("nearby refs")
References that appear immediately outside a newtheorem block are called "nearby refs". These links are dotted and can be toggled on/off.
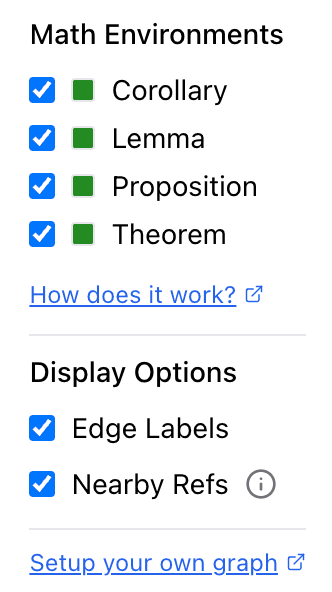
Interface
Panel
The graph interface includes a control panel on the right side that lets you customize the visualization:
- Math Environments: Filter which types of mathematical objects to display
- Display Options: Toggle edge labels and nearby references on/off
Interactive UI
- Hover: Move your cursor over any node to highlight its connections
- Click to Pin: Click on a node to pin it, keeping the node and its dependencies highlighted
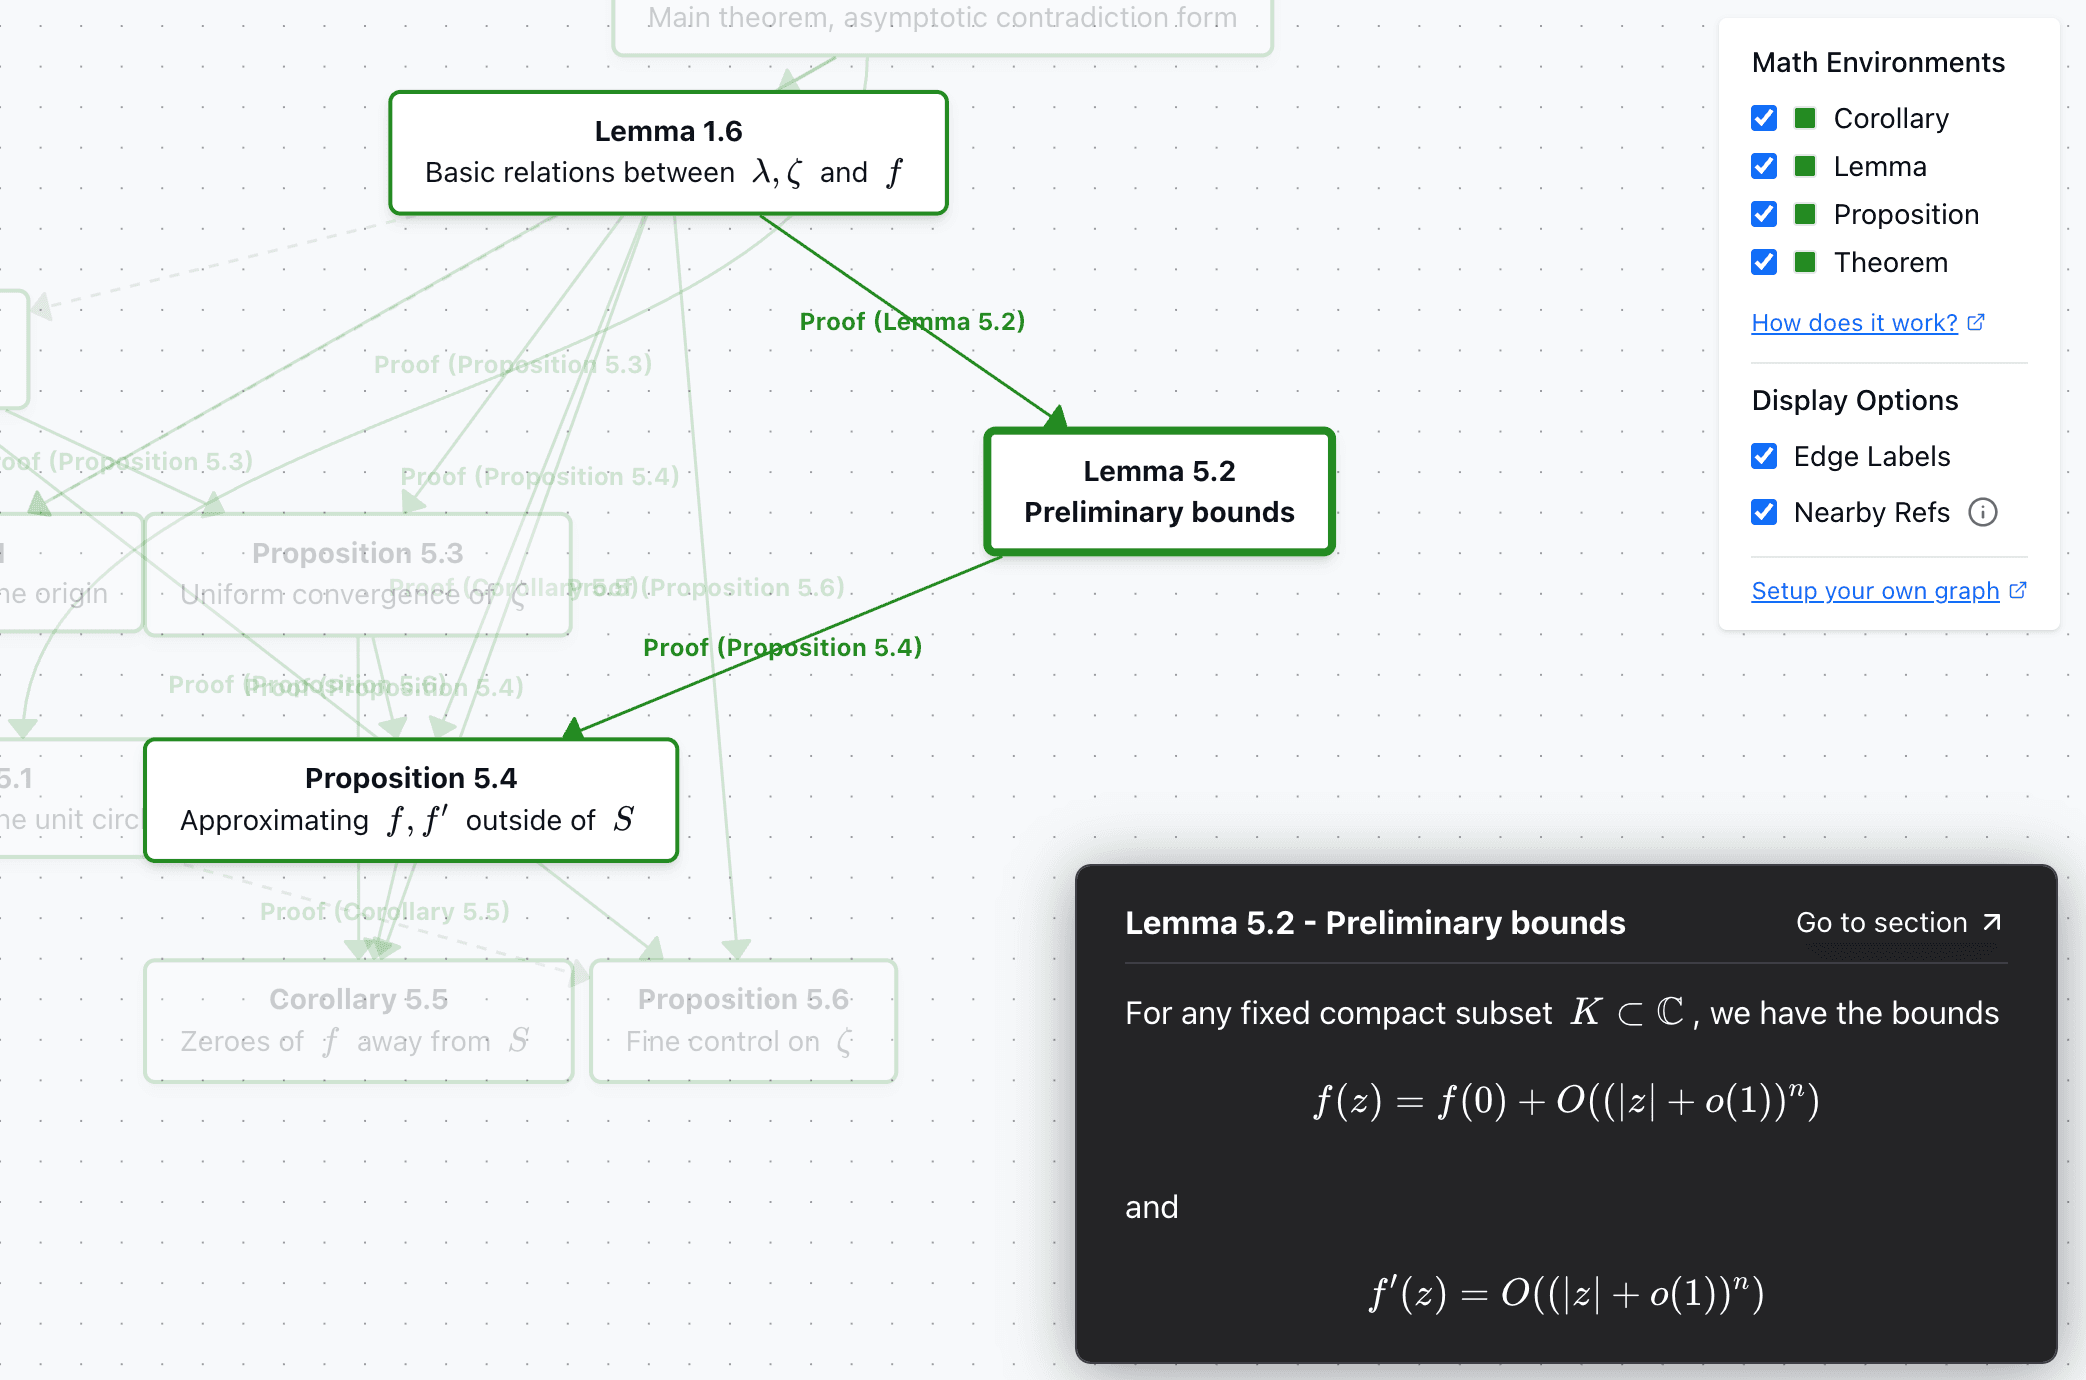
Color Coding
- Forest Green: Core mathematical statements (theorems, lemmas, corollaries, propositions)
- Other Colors: Different environments may use different colors (e.g., gray for remarks/examples)
Creating Your Own Dependency Graph
To generate a dependency graph for your own LaTeX paper:
- Upload: Click "My Uploads" and upload your LaTeX source file
- Processing: After uploading, you'll be redirected to your dashboard where the paper will be processed
- View Paper: Once processing is complete, click the blue "View as HTML" button
- Graph Tab: Click on the "Graph" tab at the top to view the dependency graph